Conformance Checker
The conformance checker lets you automatically compare a reference process model with the actual process flows discovered from the data. The difference between the model and actual flows is returned in the form of a list of violations, which can include observed behavior that is not allowed by the model, as well as behavior that is in the model but not observed in reality.
The conformance checker is organized into sections. You can navigate across these sections by using the left-hand side navigation bar.
Creating a conformance checker
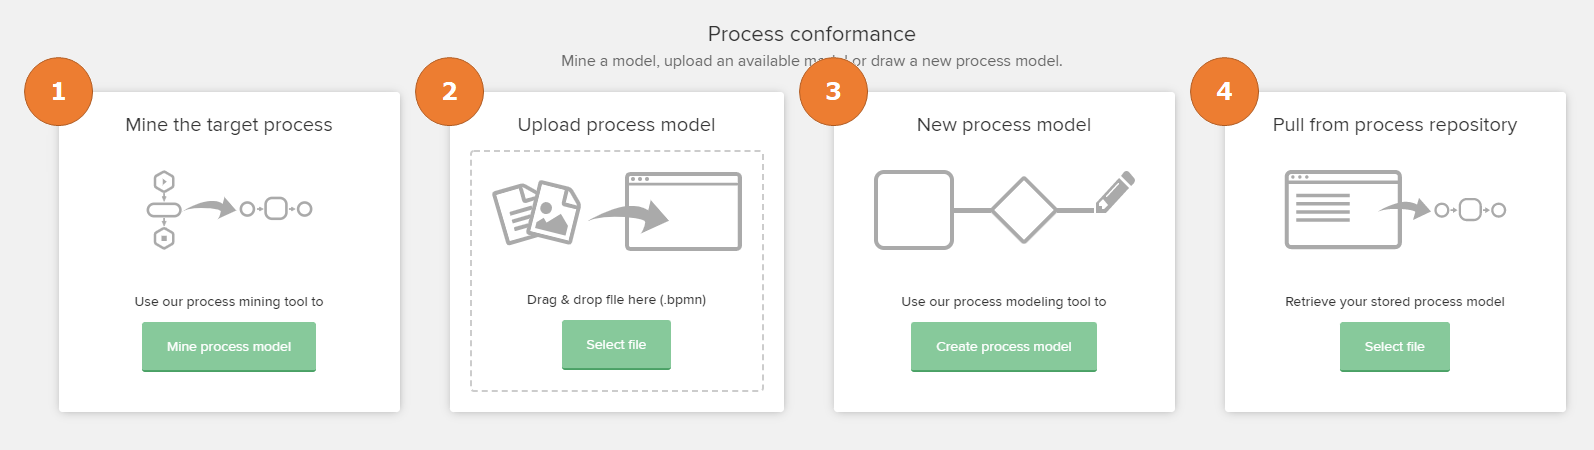 |
In a newly initialized conformance checker, there are four options available to define the process model:
Mine the target process: Mine the process model from the data. A variant explorer will be shown, where you can then select which variants are included in the target process.
Upload process model: Upload an existing .bpmn file containing the process model. The file must be in accordance with the BPMN 2.0 standard.
New process model: Create a custom process model with the BPMN editor.
Pull from process repository: Use an existing process model from the process repository.
Explaining the Conformance overview screen
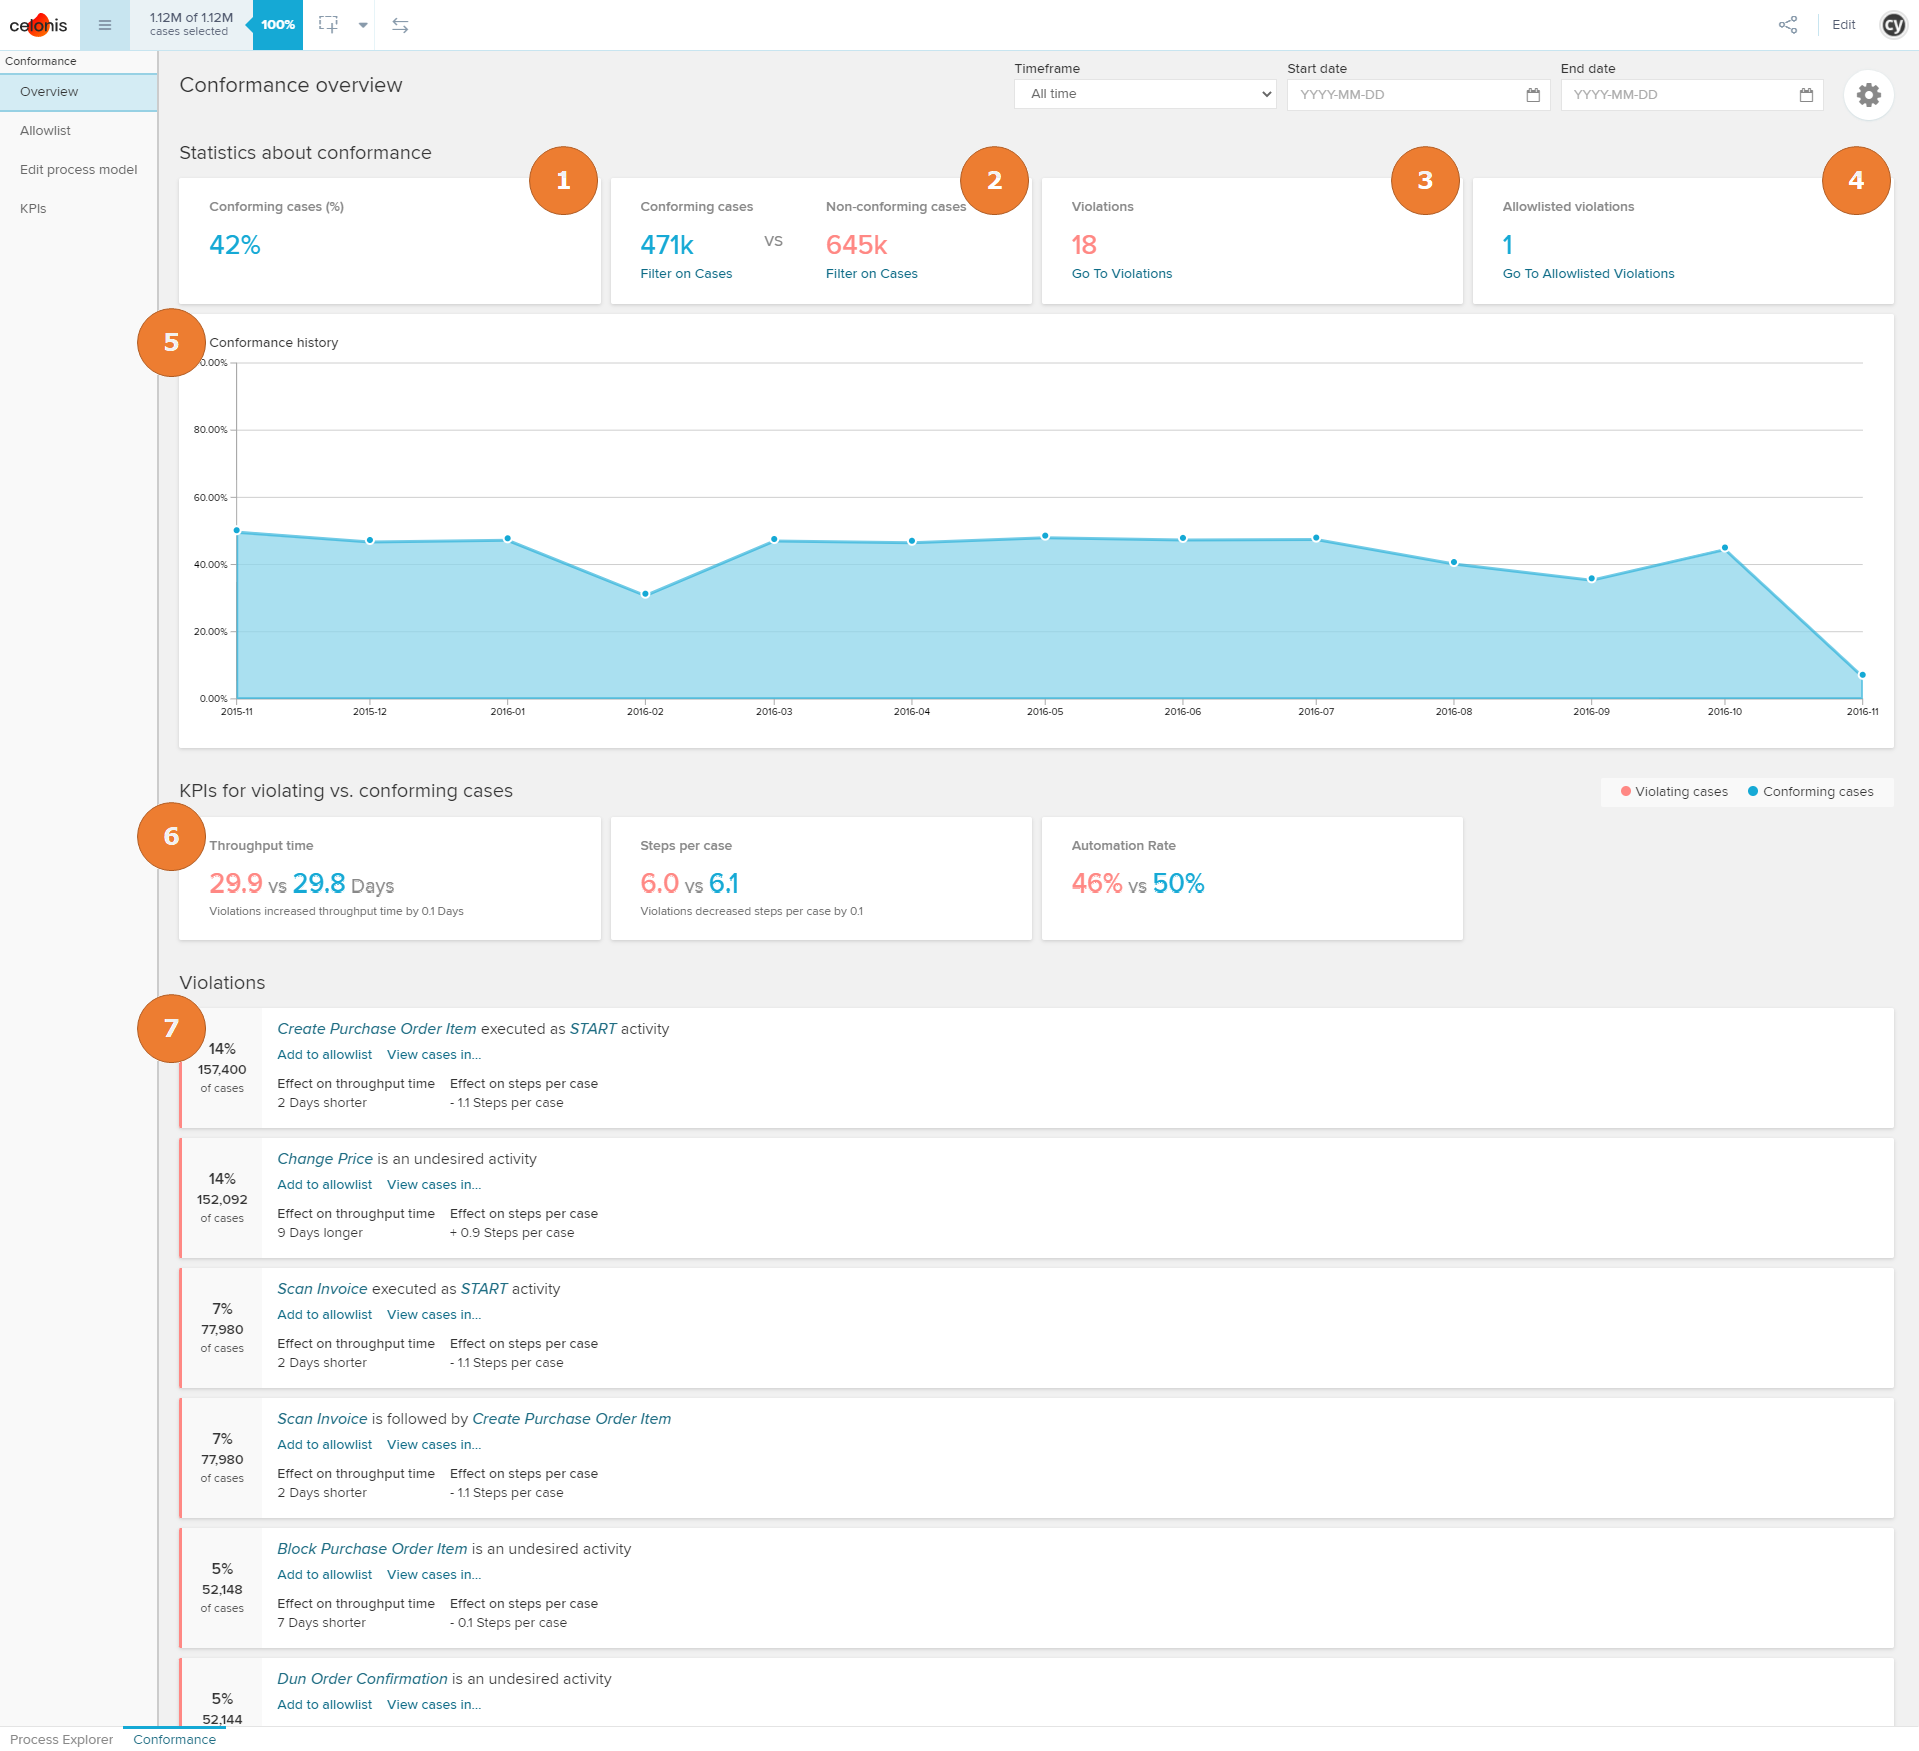 |
The Conformance overview screen provides statistics on overall process conformance, the numerical impact of non-conformance on KPIs, and deviations from the process model detected by the conformance algorithm.
The percentage of conforming cases according to the defined process model.
How many cases are conforming and how many cases are not conforming. You can apply a filter on either set of cases by clicking Filter on Cases.
The number of distinct violations that were found.
The number of distinct violations that are currently allowlist.
A graph of the conformance rate over time. The time frame can be adjusted using the dropdown or date selection at the top of the overview.
A comparison of KPIs for conforming vs. non-conforming cases. By default, throughput time and steps per case are shown. Additional custom KPIs can be added to the comparison in the KPIs section.
A list of distinct violations that were found. Note that the displayed percentages may not sum to 100% because a case can contain more than one violation. For each violation:
Add to allowlist will remove it from the list of violations. This only changes the calculations in the overview, not the underlying process model.
View cases in... will filter the analysis on the cases with that violation and bring you to an existing sheet. This gives you the ability to isolate and further analyze an individual violation.
Violation details
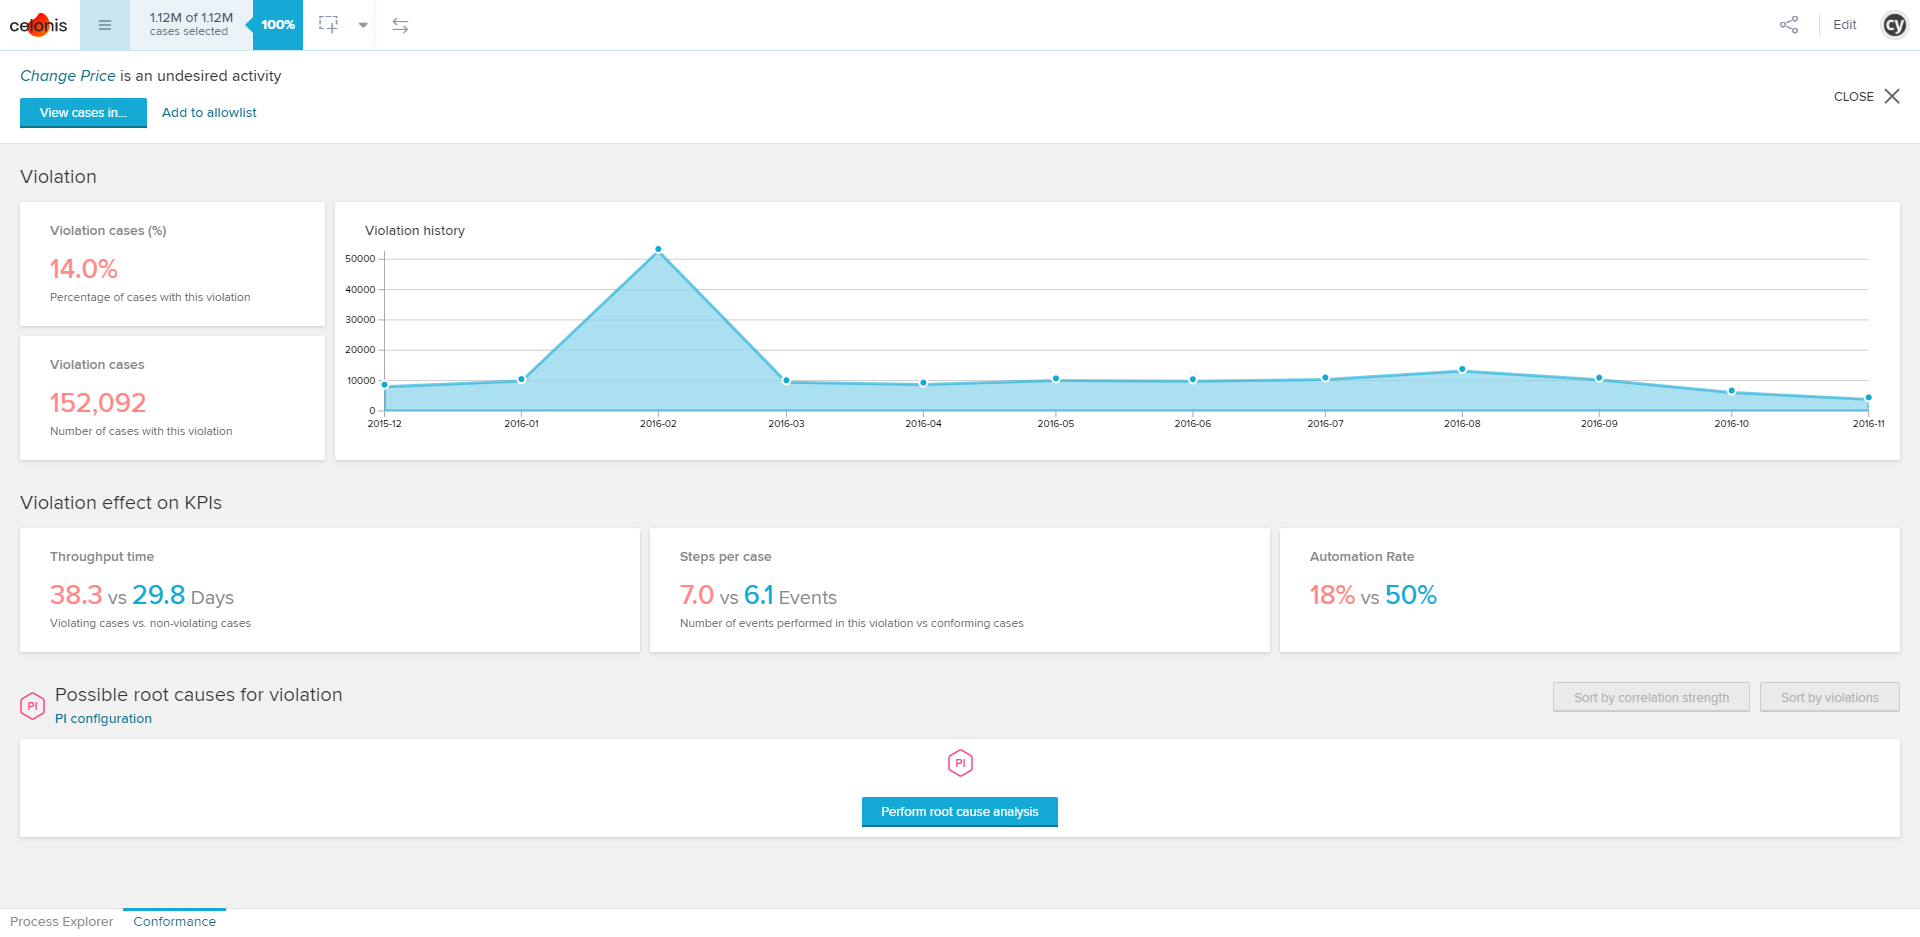 |
A more detailed, full-screen view of each violation can be opened by clicking on the panel containing the violation.
In the header, the violation can be added to the allowlist or filtered on, as described above. Most of the statistics from the overview are also shown here.
Perform root cause analysis
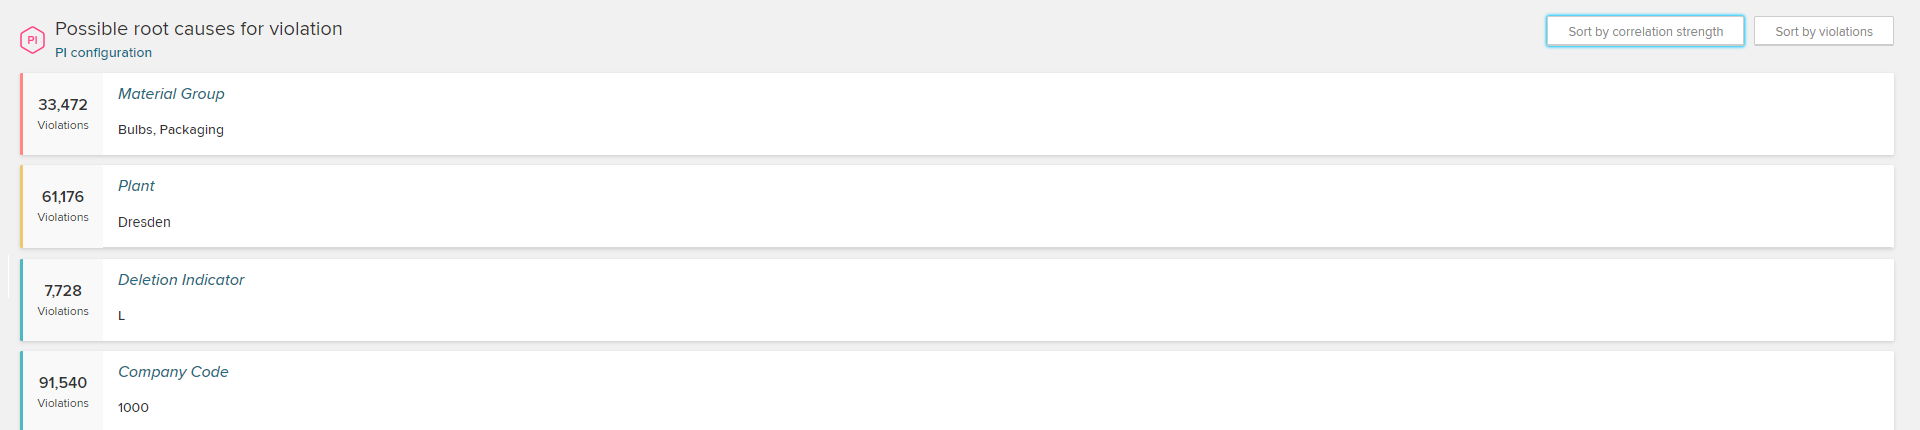 |
This feature detects root causes by computing the percentage of violating cases as well as the absolute number of violating cases for every unique value of a dimension. The dimension-value combinations are then ranked by lift. You can sort according to either metric with the buttons Sort by correlation strength and Sort by violations. By default, all dimensions available in the data model are used. They can be customized in the PI configuration.
Types of violations:
X is an undesired activity.
X is a missing activity COMING SOON.
X is followed by Y.
X is executed as start activity.
Incomplete case.
Too complex.
Allowlist
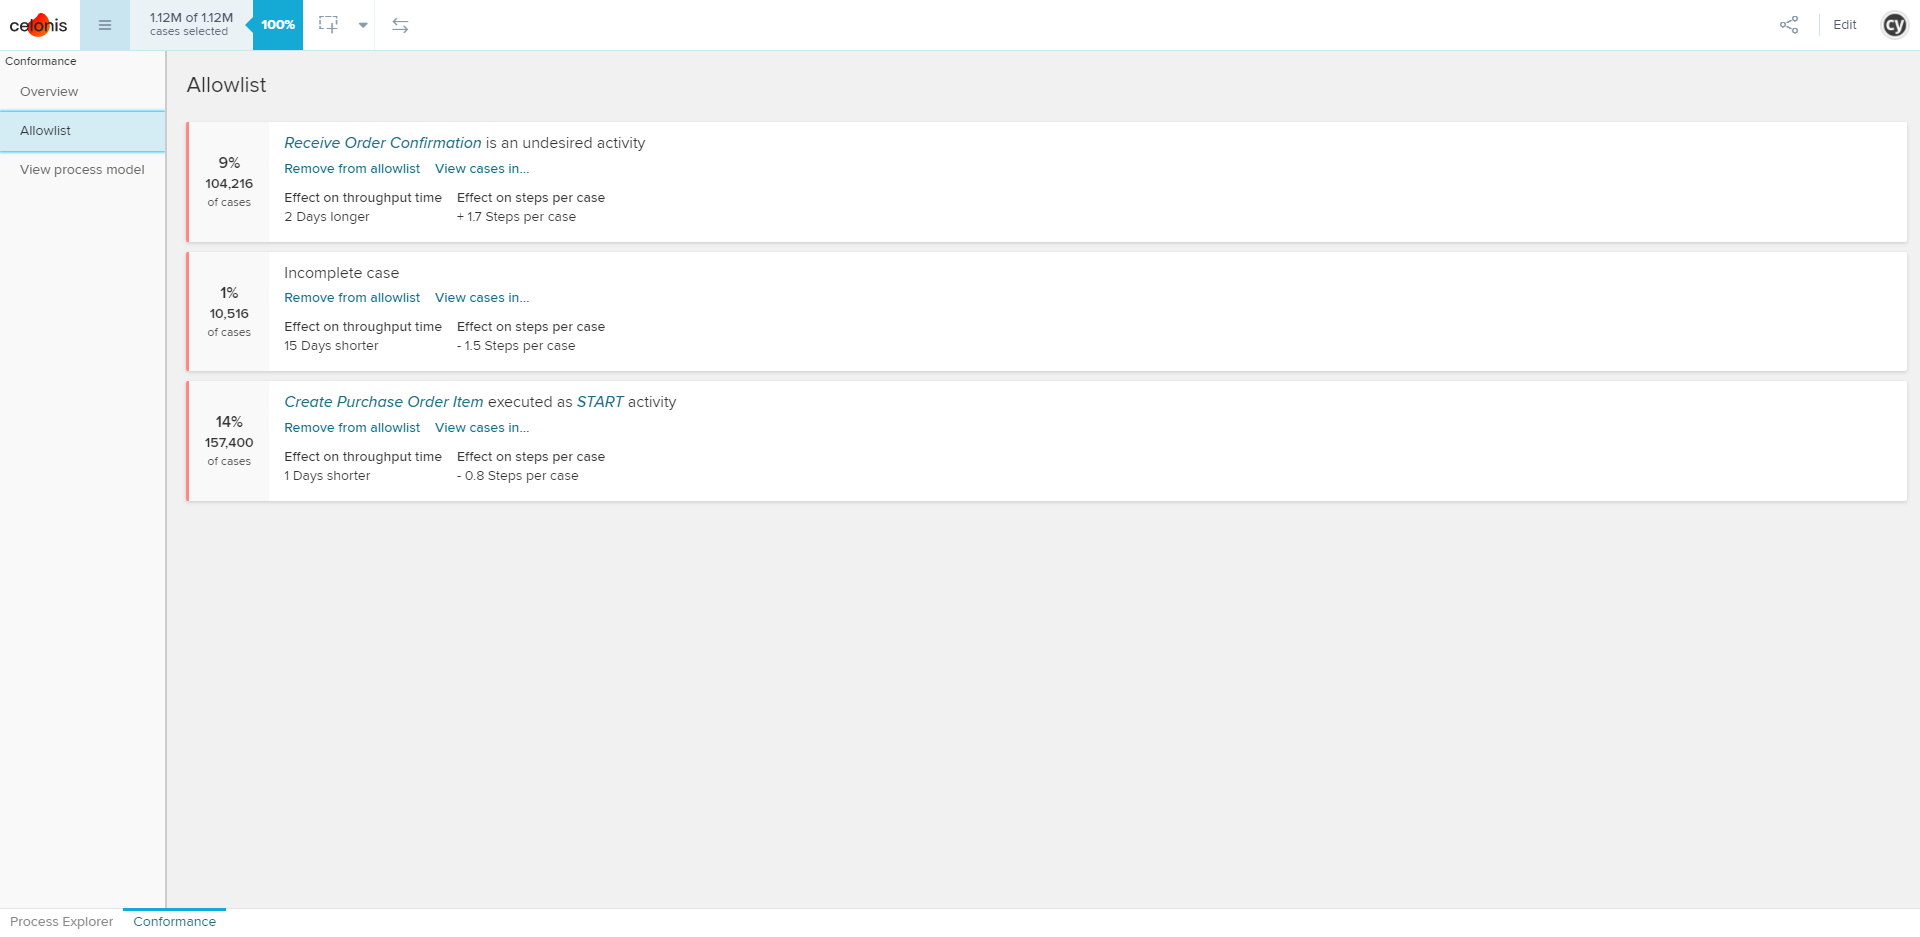 |
The allowlist section lists all violations added to the allowlist from the overview.
If a violation is on the allowlist, it will still be included in the conformance calculations. However, it will be overridden and considered to be conformant for the purposes of the conformance checker. You can remove the violation from the allowlist by clicking Remove from allowlist.
View/Edit process model
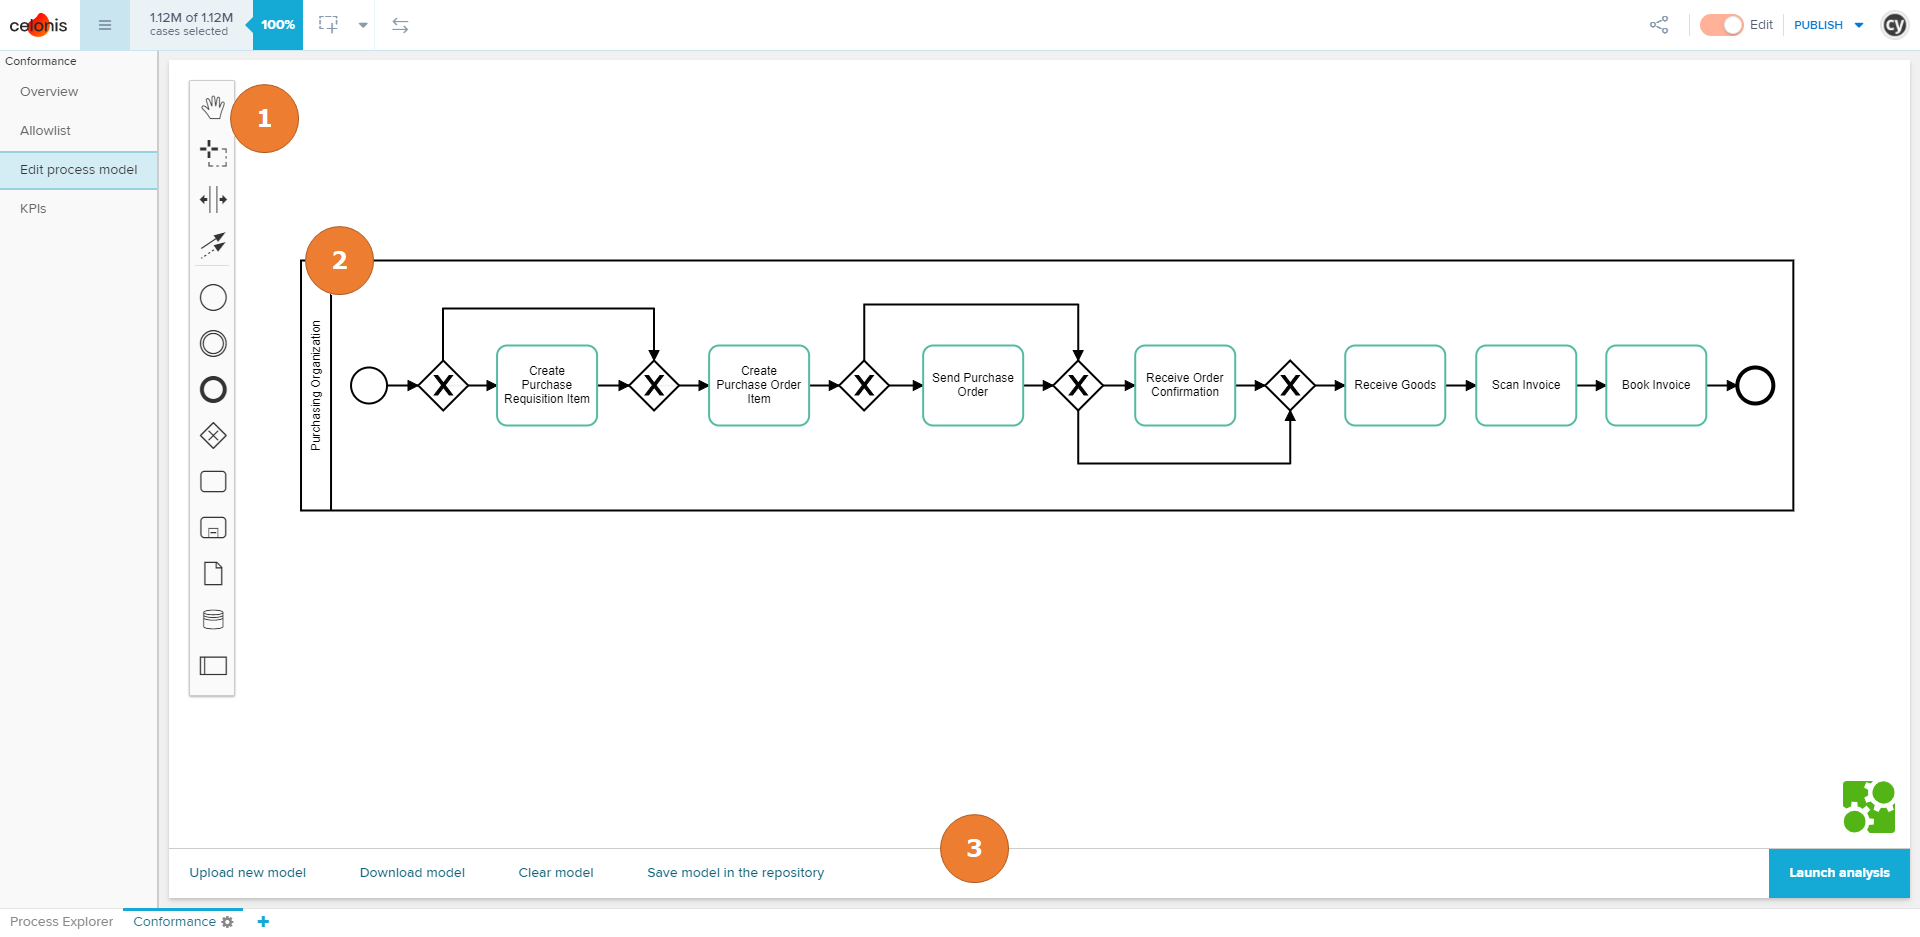 |
Once defined, the process model can always be viewed (by members) and edited (by analysts with sufficient permissions) from this section.
Note
BPMN (Business Process Model and Notation) is the global standard for process modeling. The process model is represented in BPMN 2.0 syntax, which consists of activities, connections, gateways, and start/end nodes. Other elements like annotations are ignored. To learn more about BPMN, visit https://www.omg.org/bpmn/index.htm.
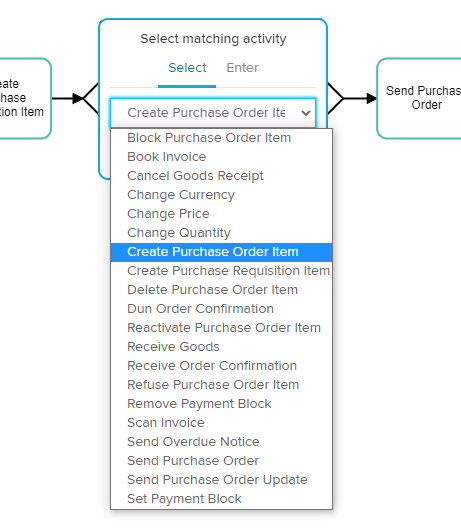
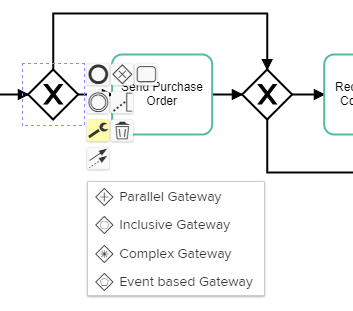
Explanations of labels in the screenshot on the left:
Access to tools and elements that can be added to the model.
Click on a single element to see additional actions that can be taken on the element, e.g. changing the activity or type of gateway.
Using the action bar at the bottom of the page, the displayed model can be saved as a .bpmn file or in the process repository. Clear model will reset the conformance checker. Finally, when you have finished editing the process model, relaunch the conformance check by clicking the Launch analysis button.