Exploring deviations between your process and the target process
Select
 .
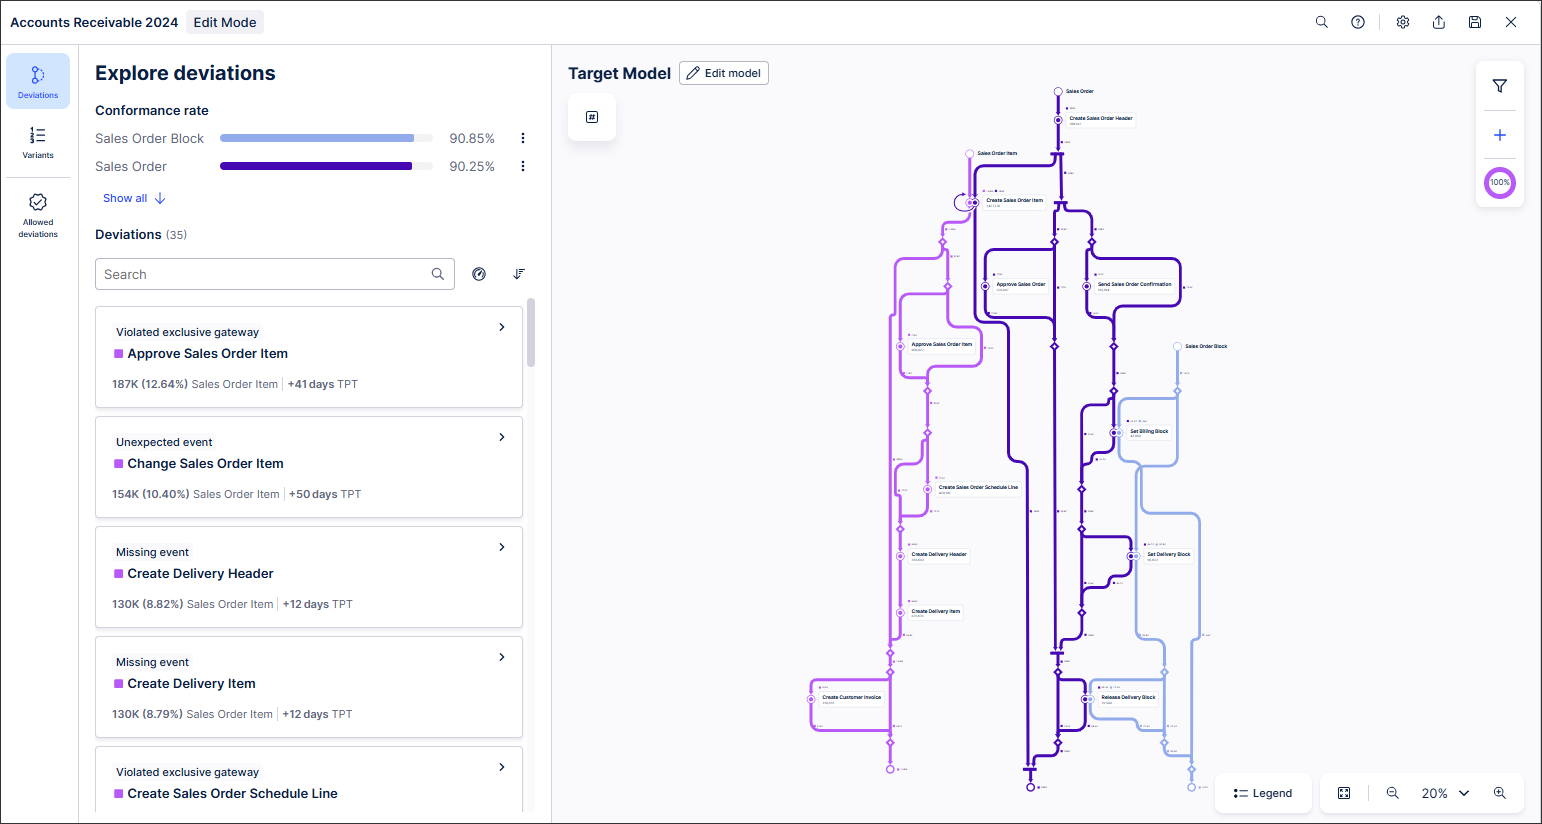
.The Explore deviations screen opens.
Note
The Conformance rate shows the percentage of events in your process that conform to the target model process for each event log. If the Conformance rate is 100%, for example, your process conforms exactly to the target model.
You can also copy the Conformance rate PQL query to the clipboard. You can then use it in a Studio View or as a KPI in the knowledge model.
In the process graph, select a colored line to select the event log you want to explore.
In Actual behavior, view the:
Event log and event where the deviation occurs.
Percentage of cases the deviation occurs in.
Impact on the throughput time caused by the deviation.
Tip
Click
 to sort deviations based on their impact on the displayed KPIs. In this example, you can sort on Frequency and Throughput time (TPT).
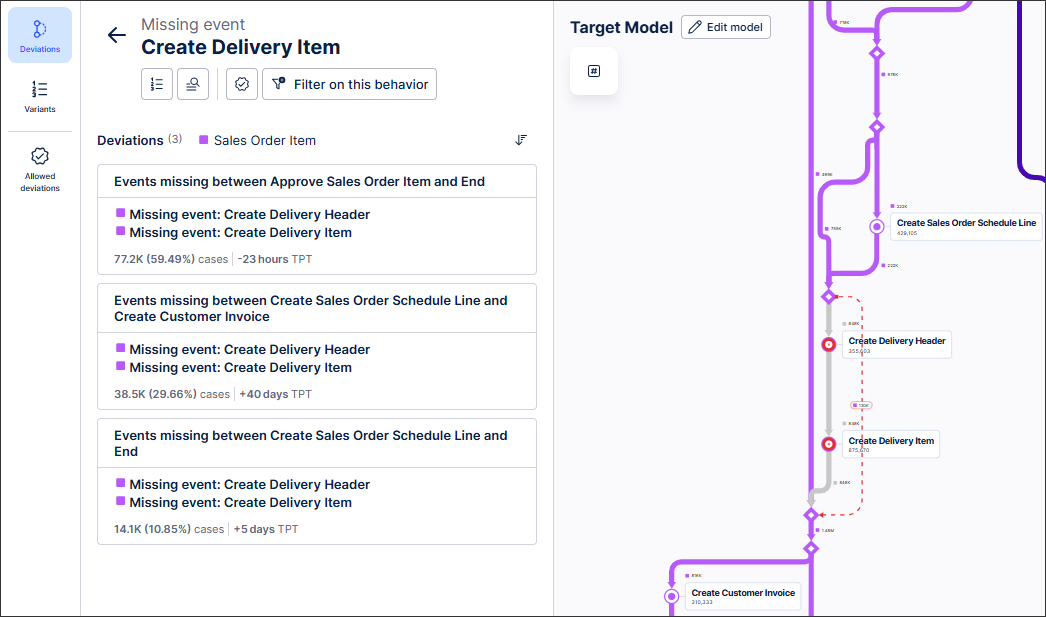
Select any deviation in Actual behavior to view more details about that deviation.
The dashed line shows where the deviation occurs. Here, this is the location of a missing event.
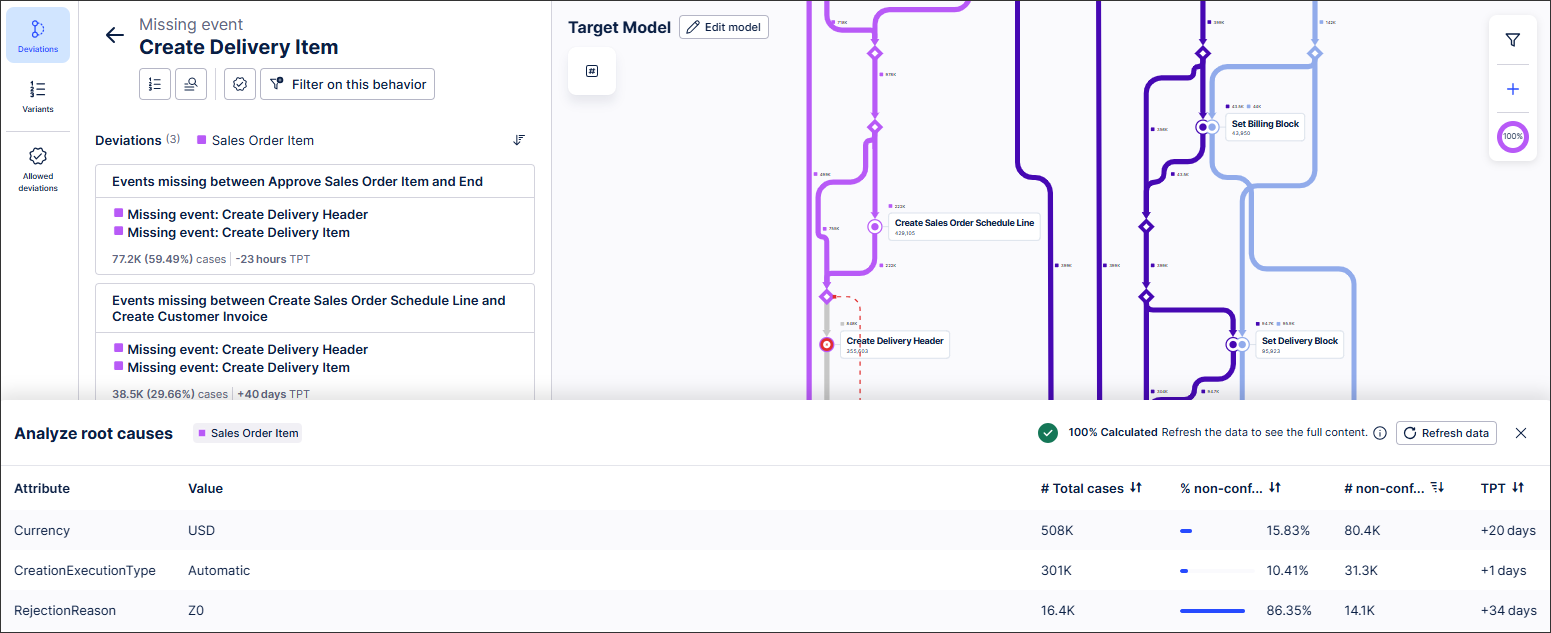
Select the Analyze root causes button.
A table that displays detailed information about the selected deviation appears.
Explore the variants associated with specific deviations and perform an end-to-end analysis.
Allowlisting deviations in Process Adherence Manager
Tip
You can allowlist specific deviations from Explore deviations. Once allowlisted, these deviations will move to the allowlist and will no longer appear in Explore deviations. Allowlisted deviations don’t affect Conformance rate.
In Explore deviations, select the deviation you want to allowlist.
Select
 .
.Your deviation is moved to your allowlist.
Select
 at any time to see your allowlist.
You can also remove any entries from your allowlist here.
Understanding deviation categories
Note
For information on allowlisting specific deviations, see Allowlisting deviations.
Deviation category | Description |
|---|---|
Missing event | An event that is required in the target model but does not occur. |
Occurred too often | An event that should only happen once in the target model but occurs multiple times. This could be because of a loop or duplicates. |
Occurred out of sequence | An event that was required in the target model but occurs in the wrong place in the process flow. |
Unexpected event | An event occurred that is included in the data model but not included in the target model. Tip Unexpect event deviations are included in your target model by default. You can hide all unexpected event deviations in Edit mode by selecting Settings |
Violated exclusive gateway | Two possible events occur at a point in the process where only one event should occur.orOne or more events that should occur sequentially do not occur at all. |

Deviation category examples
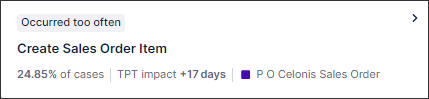
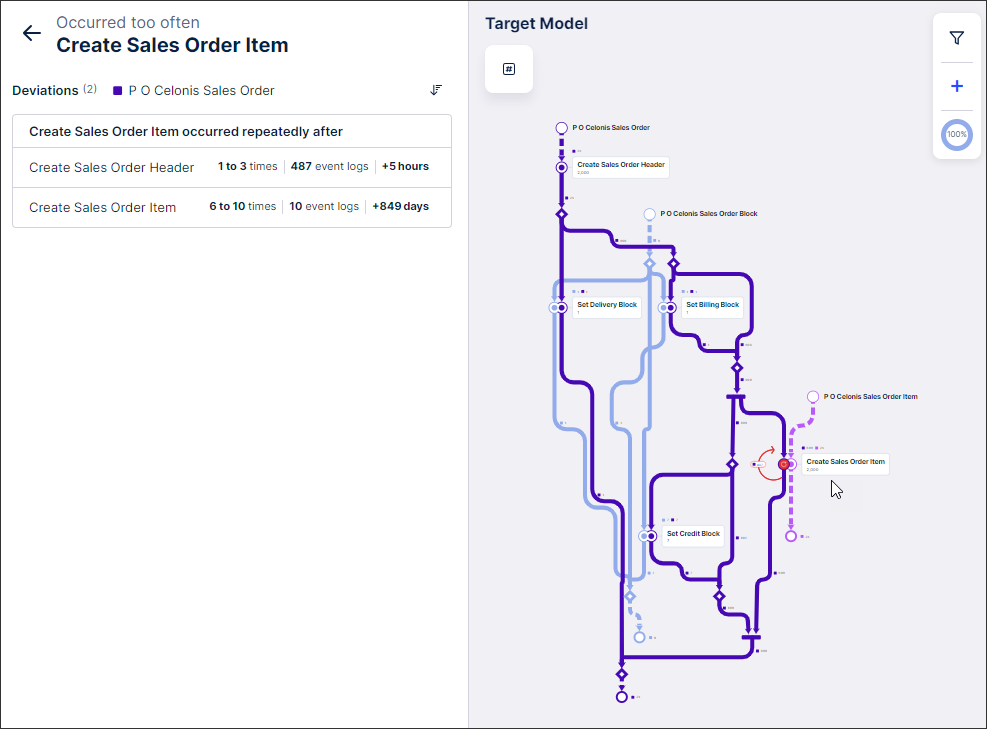
The Create Sales Order Item event in the PO Celonis Sales Order event log occurred too often for 24.85% of cases and had an impact of an additional 17 days on throughput time
 |
In the first deviation, the Create Sales Order Item event occurred repeatedly after the Create Sales Order Header event in 487 event logs, adding an extra five hours of throughput time.
In the second deviation, the Create Sales Order Item event occurred repeatedly after itself (in a loop) across 10 event logs, adding 849 days to the throughput time.
 |