Knowledge Model - Event Logs
Event Logs take the sequence of events described in your activity tables and allow you to store these as objects in the Knowledge Model (KM). This enables you to use the content of your Activity Tables inside your Studio Views.
You can use event logs in both the case explorer and process explorer components.
For more information about the case explorer, see: Case Explorer.
And to understand how to use event logs in the process explorer, see: Using event logs in the Process Explorer.
Creating event logs in the Knowledge Model
To create event logs in your KM:
Click Studio and then open the package containing the KM you want to create the event log in.
Open the KM asset.
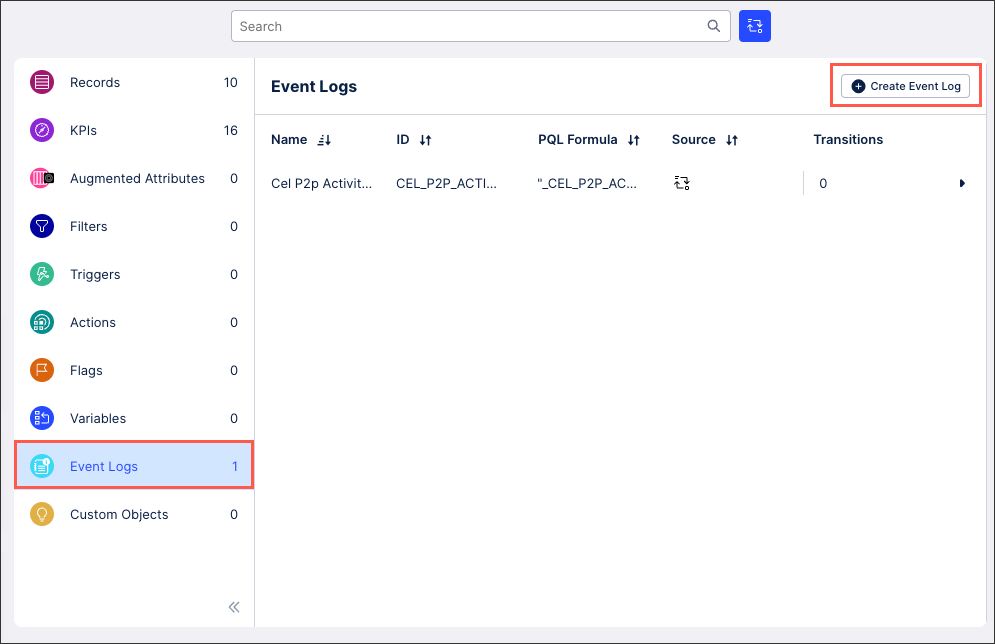
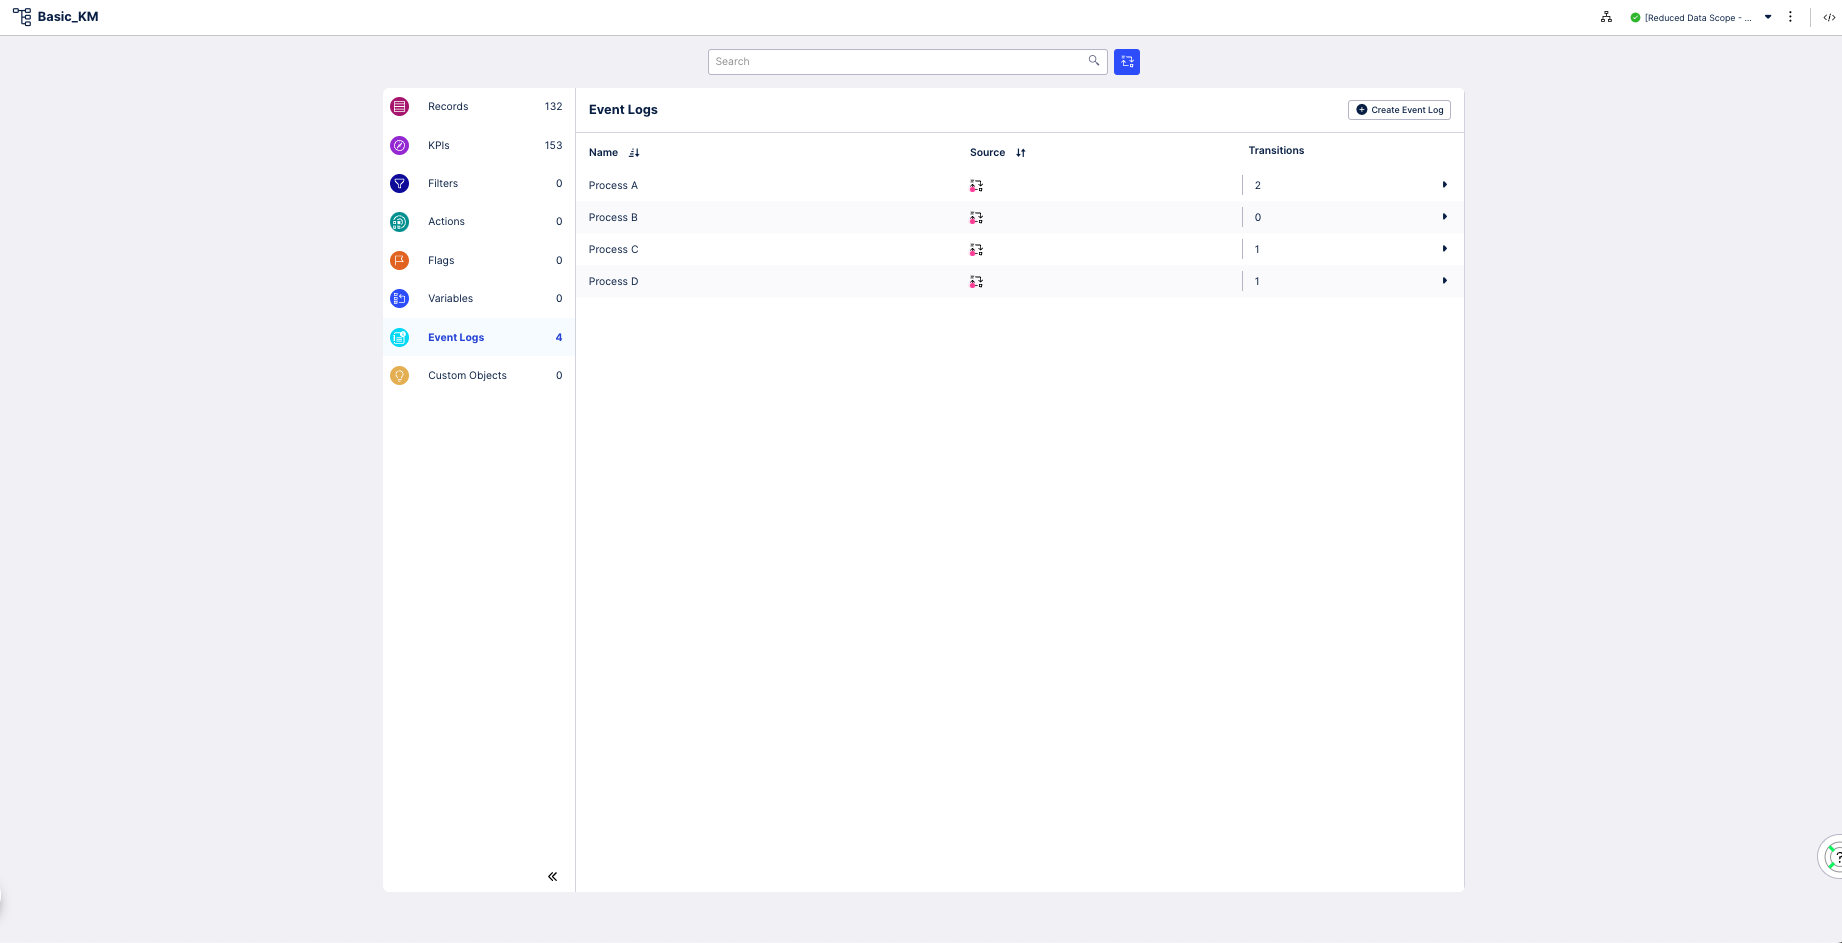
Click Event Logs and select Create Event Log.
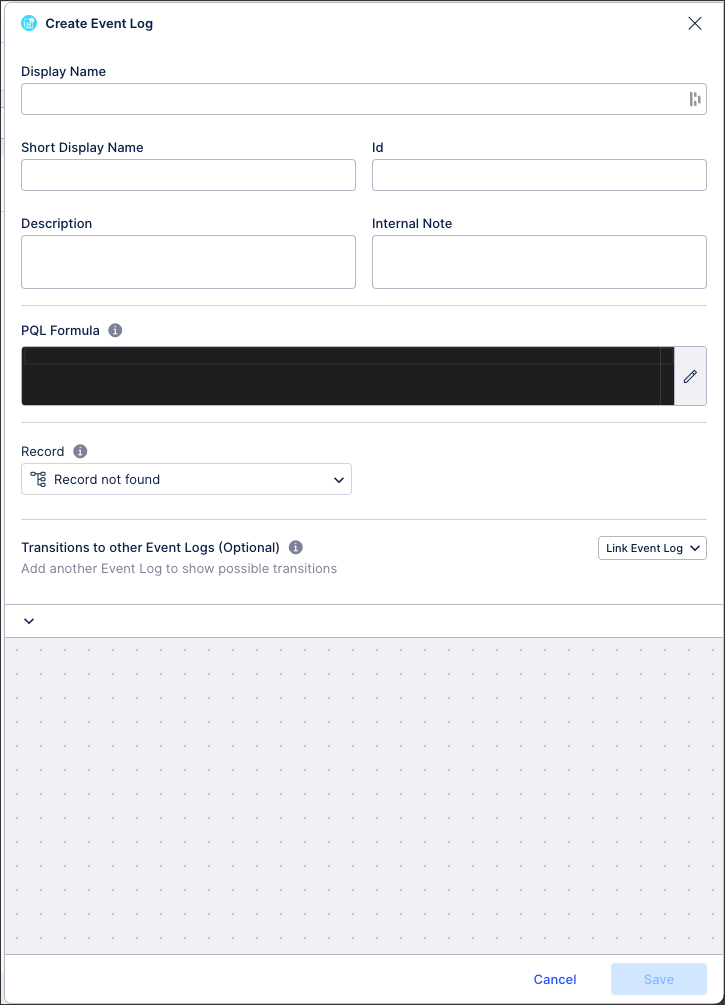
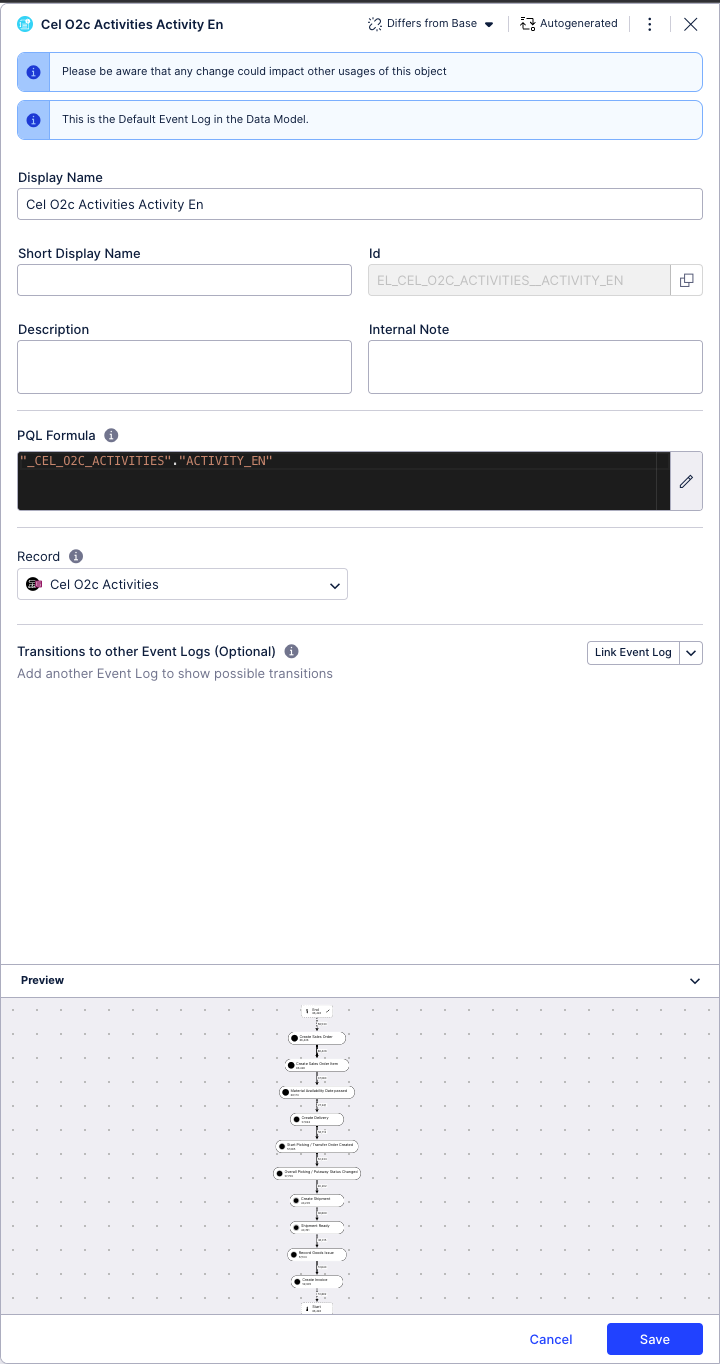
Configure your event log using the following settings:
Display Name: A human-readable label used in the user interface.
Short Display Name: Shorter human readable label for the object shown automatically on the Views whenever the Display Name is truncated. Can contain max 20 characters.
ID: A unique technical identifier used to reference this event log. Must be unique within all attributes in the KM.
Description: A human-readable description for the event log.
Internal Note: A field only visible within the KM.
PQL formula: Write the PQL reference for the activity table you want to show in your event log.
Record: Select the record you want to associate with a profile View.
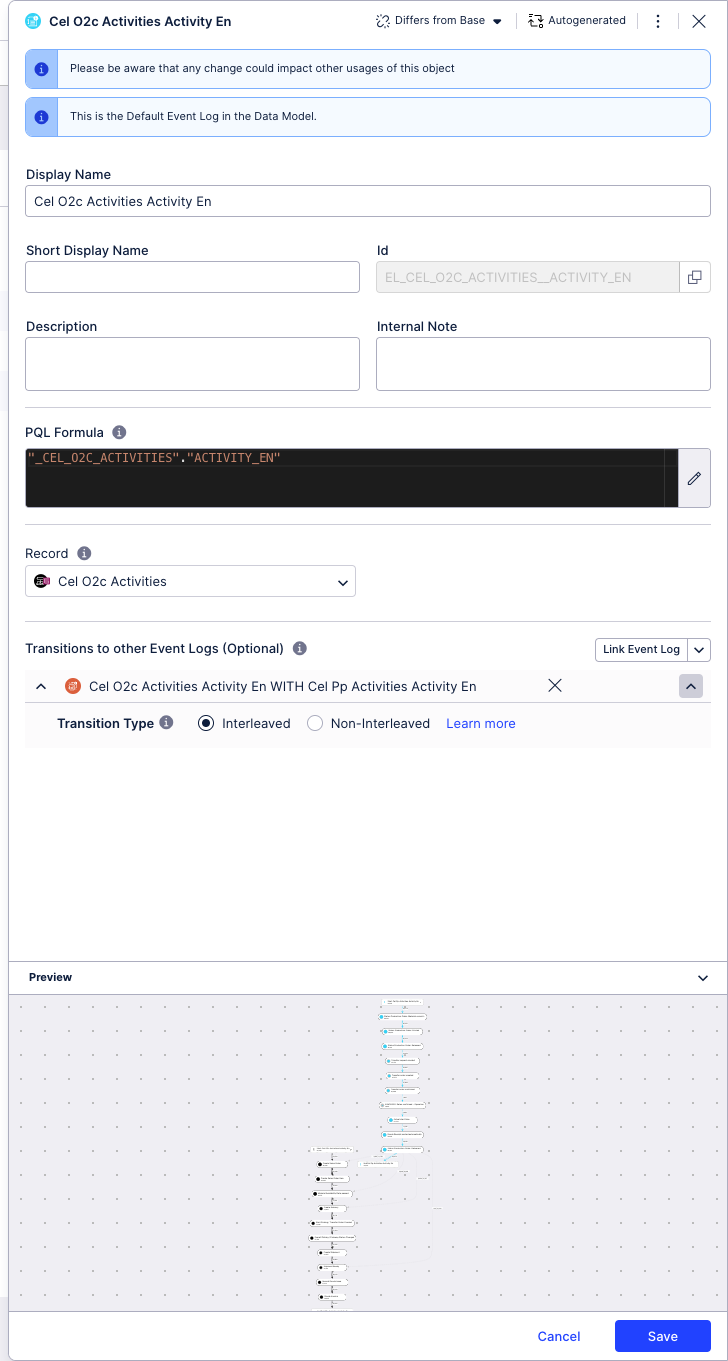
Transition to other event log: See the possible transition between your current event log and another event log in your KM by adding an event log from the dropdown.
Use the preview to check if your event log is working as desired. If not, re-configure your event log and try again.
Click Save.
The event log is added to your KM and can be used in the process explorer.
Managing existing Knowledge Model objects
You can manage existing Knowledge Model objects by clicking the Options icon:
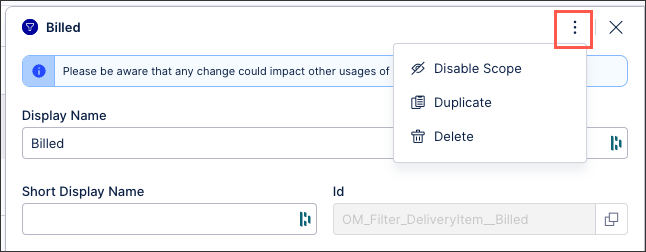 |
You then have the following options per object:
Disable scope: By disabling the scope of an object, the object then can't be used anywhere within the package. This is a good option if you want to disable an object but delete it from your KM.
Duplicate: This opens the create object window with the configuration of the object you are duplicating used as a template. When saving a duplicate object, the object ID must be unique.
Delete: This deletes the object from the KM and any references to that object in existing content. When deleting an object, there is no undo or recovery option.
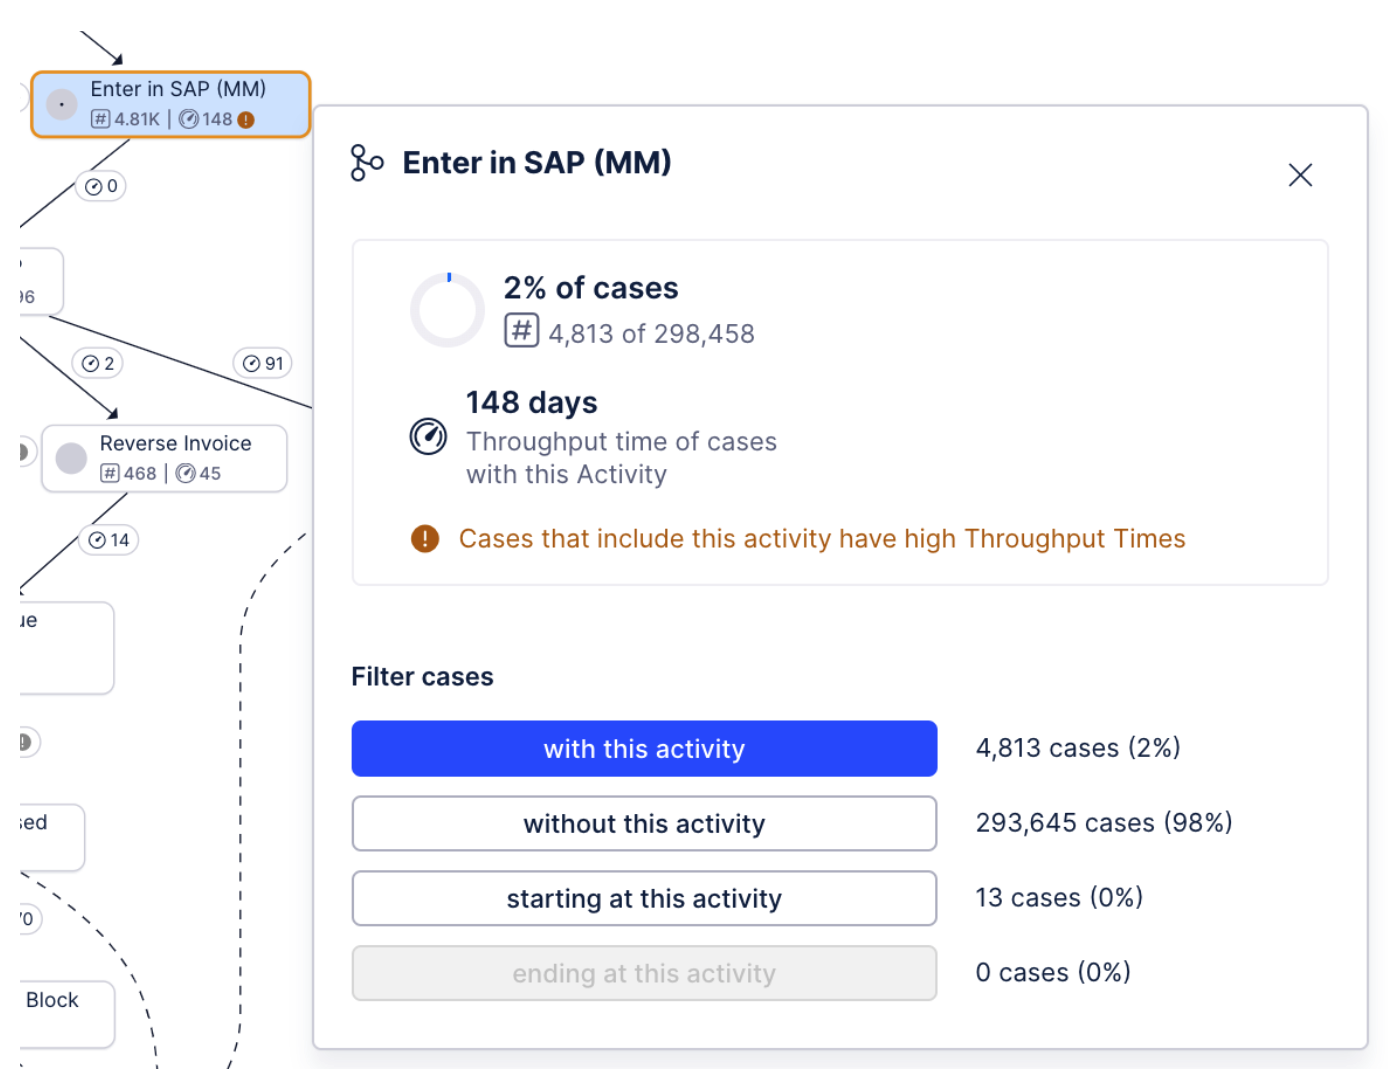
Using event logs in the Process Explorer
Event logs are used by components such as the Process Explorer. Event log metadata contains all the necessary configurations to visualise single or multiple processes in the process explorer. This includes:
Event logs: Define the activities that should be visualized on the process graph. See: Event Logs
Transitions: Define the relationships between different event logs. This is applicable when multiple event logs are visualized on the process graph. See: Transitions
KPI Views: Define the KPIs that should be displayed on activities and connections in the process graph. See: KPI Views
Event logs can be created using either the Visual Editor or the Code Editor.
Using the Visual Editor
Using the Visual Editor, Event Logs can be created and edited from inside the Event Log tab in the KM. This tab contains all the Event Logs that exist in the KM. You can create a new Event Log by clicking on the plus button on the top right corner of the Event Log main list. This will lead you to the Event Log creation, which contains all Event Log associated value assignments.
 |
These associated value assignments are the following:
General Settings:
Display Name: A human-readable label used in the user interface.
Short Display Name: Shorter human readable label for the object shown automatically on the Views whenever the Display Name is truncated. Can contain max 20 characters.
ID: A unique technical identifier used to reference this Attribute. Must be unique within all attributes in the Record.
Description: A human-readable description for the Attribute.
Internal Note: A field only visible within the KM.
Event Log Specific Fields:
PQL Formula: Contains the PQL query that links an Activity Table to your Event Log. The PQL formula here is based on the ID for activity table in your Knowledge Model records, for example:
"ACTIVITIES"."ACTIVITY_EN"
This is created using the ID from the Event Log and the ID from the relevant record.
Record: Connects a Record to the Event Log to link a profile View.
In YAML, Event logs have the following value declaration format:
 eventLogsMetadata:
 eventLogs:
   - id: O2C_EVENTLOG
     displayName: Order Management
     pql: '"O2C_ACTIVITY_TABLE"."ACTIVITY_EN"'
     recordID: O2C_ACTIVITY_TABLE
id: A unique technical identifier used to reference this Event Log. Must be unique within all Event Logs in the Record.
displayName: A human-readable label used in the user interface.
shortDisplayName: Shorter human readable label for the object shown automatically on the Views whenever the displayName is truncated. Can contain max 20 characters (optional)
description: A human-readable description for the event log (optional)
pql: Contains the PQL query that links an activity table to your event log.
recordID: Is the id the Record connected to the event log to link a profile View.
If multiple event logs are involved, the process explorer can display the transitions between the event logs. Transitions also can be defined in the KM using either the Visual Editor of the Code Editor.
Using the Visual Editor
Transition Specific Field Fields:
Transition Name: With the name of the Event Logs that are connected through the transition.
Transition Type: To specify the type of Transition that will be created between the Event Logs.
Note
The preview for your Event Log will only show a Transition if the selected Event Logs have cases that flow through both processes. If the Event Logs have no common cases, the preview will not show any connection between the Event Logs.
Transitions are listed under a separate category in YML, which has the following declaration format:
transitions:
   - id: O2C_P2P
     displayName: O2C to P2P
     firstEventLogId: O2C_EVENTLOG
     secondEventLogId: P2P_EVENTLOG
id: A unique technical identifier used to reference this Event Log. Must be unique for all Event Logs in the KM.
displayName: A human-readable label used in the user interface.
shortDisplayName: Shorter human readable label for object shown on the Views whenever the displayName is truncated. Can contain max 20 characters (optional)
firstEventLogId: With the ID of the first event log involved in the transition.
secondEventLogId: With the ID of the second event log involved in the transition.
A KPI View is a collection of Activity and Connection KPIs shown on the process explorer. Multiple KPI Views can be created for an event log. Depending on the use case the appropriate KPI View can be picked by the end user for display on the process graph.
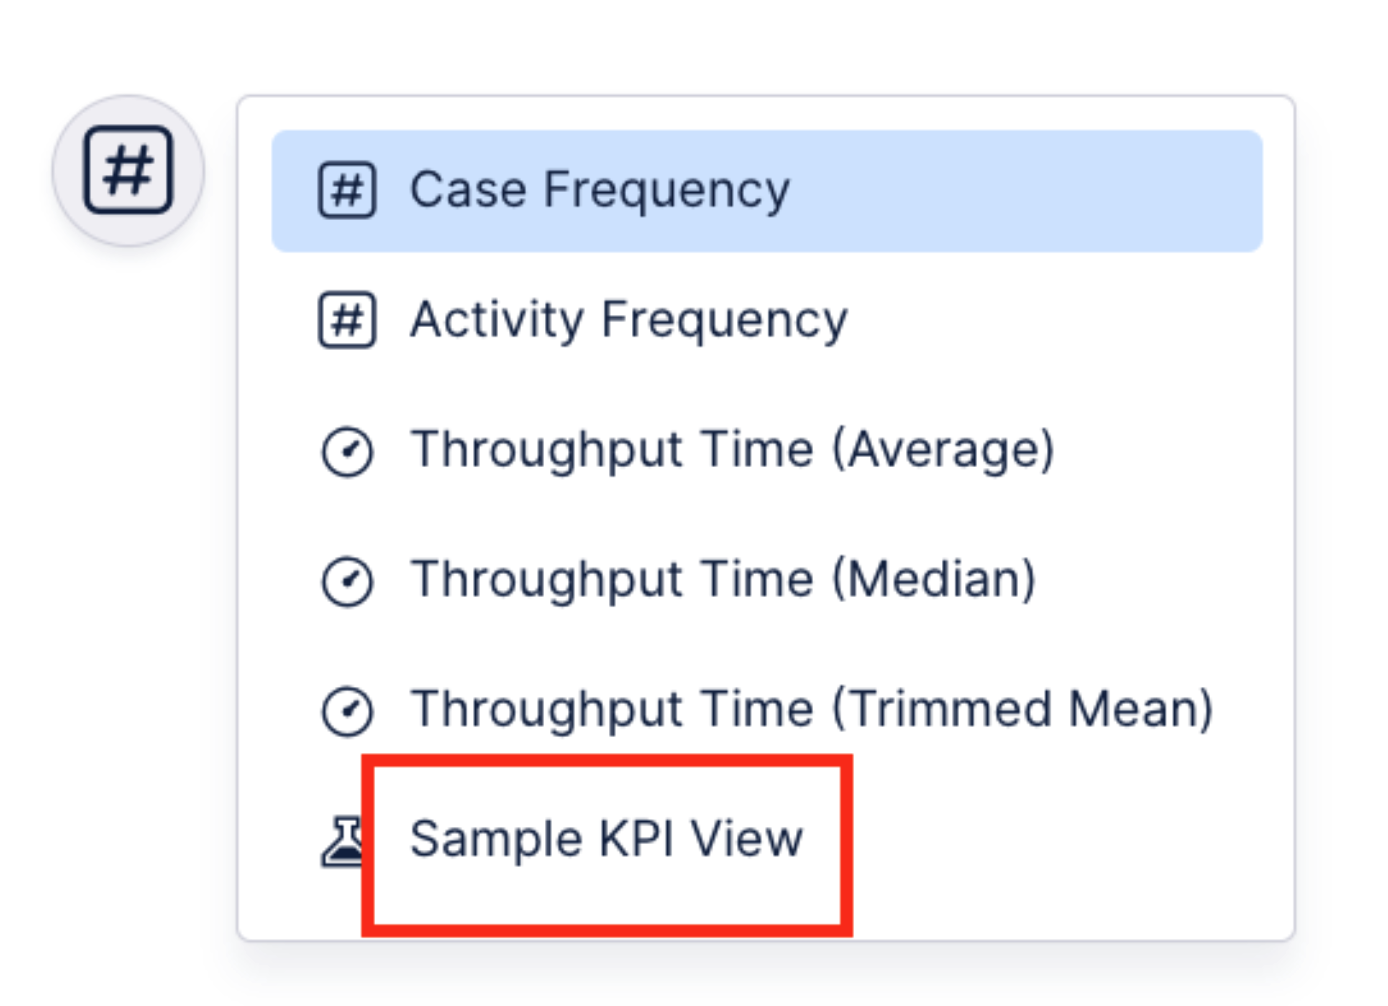
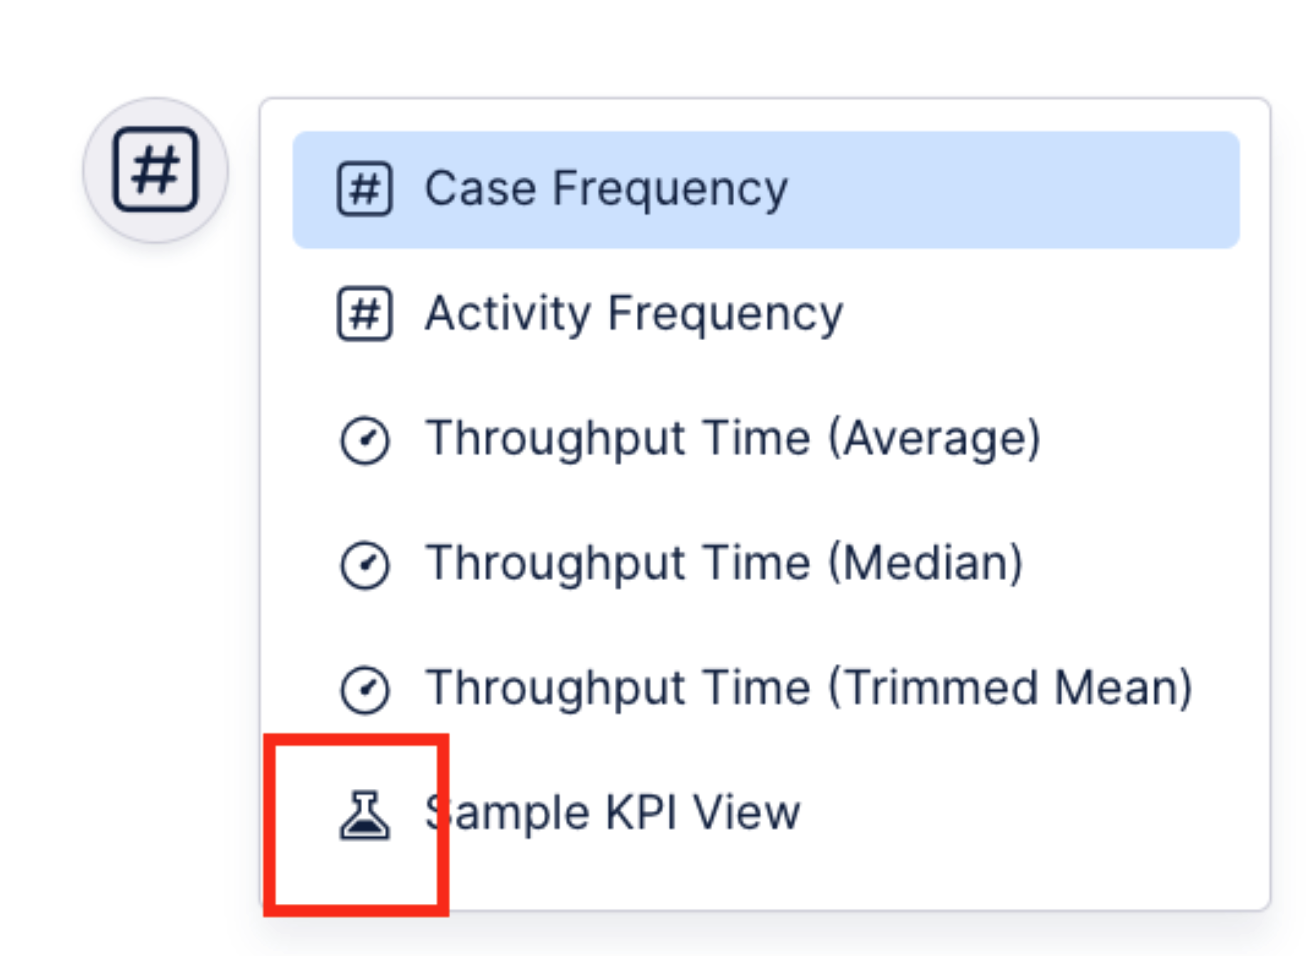
The process explorer has five in-built KPI Views.
Display Name | ID |
|---|---|
Case frequency | STANDARD_KPI_CASE_COUNT |
Activity frequency | STANDARD_KPI_ACTIVITY_COUNT |
Throughput Time (Average) | STANDARD_KPI_AVG_THROUGHPUT_TIME |
Throughput Time (Median) | STANDARD_KPI_MEDIAN_THROUGHPUT_TIME |
Throughput Time (Trimmed Mean) | STANDARD_KPI_TRIMMED_MEAN_THROUGHPUT_TIME |
Currently, KPI Views can only be created using the YAML editor. The below set of attributes and objects have to be defined for a KPI View.
Each KPI View definition will have the three parts below:
KPI View Overview definition
Event Log KPIs definition
Node and Edge KPI definition
1. KPI View Overview definition
The KPI Overview section contains general information about the KPI View. This section is used to provide details about the group of KPIs that are bundled together as one KPI View.
Attribute | Required | Type | Description | |
|---|---|---|---|---|
id | true | Free text | A technical identifier used for unique referencing of this KPI View. | |
displayName | true | Free Text | A human-readable label used in the user interface.
| |
icon | false | To represent the KPI View in the KPI switcher of the process explorer
| ||
description | false | Free Text | A human-readable description for the KPI View. | |
internalNode | false | Free Text | A section that can be used by developers to add comments | |
type | false | Options: INTERLEAVED/NON-INTERVEAVED |
2. Event Log KPIs definition
Each KPI View holds KPI definitions for multiple event logs (if multi event logs are used in the process explorer). The KPI definitions relevant for one event log are grouped together under one eventLogKPIs block.
Attribute | Required | Type | Description |
|---|---|---|---|
id | true | Free text | A technical identifier used for unique referencing of this Event Log KPIs. |
eventLogId | true | ID of Event Log | The technical identifier of the event log while defining it in the Event Log section of the KM - Event Log Metadata |
displayName | true | Free Text | A human-readable label used in the user interface. |
internalNode | false | Free Text | A section that can be used by developers to add comments |
nodeKpiIds | false | KPI ID | Deprecated |
edgeKpiIds | false | KPI ID | Deprecated |
3. Node and Edge KPI definition
Within each event log section of a KPI View, you can define the node (on activities) and edge (on connections) KPIs that should be visible. The below attributes are required to define the KPIs:
Attribute | Required | Type | Description | |
|---|---|---|---|---|
id | true | Free text | A technical identifier used for unique referencing of KPIs. | |
kpiId | true | ID of KPI | The technical identifier of the KPI while defining it in the KM - KPI section | |
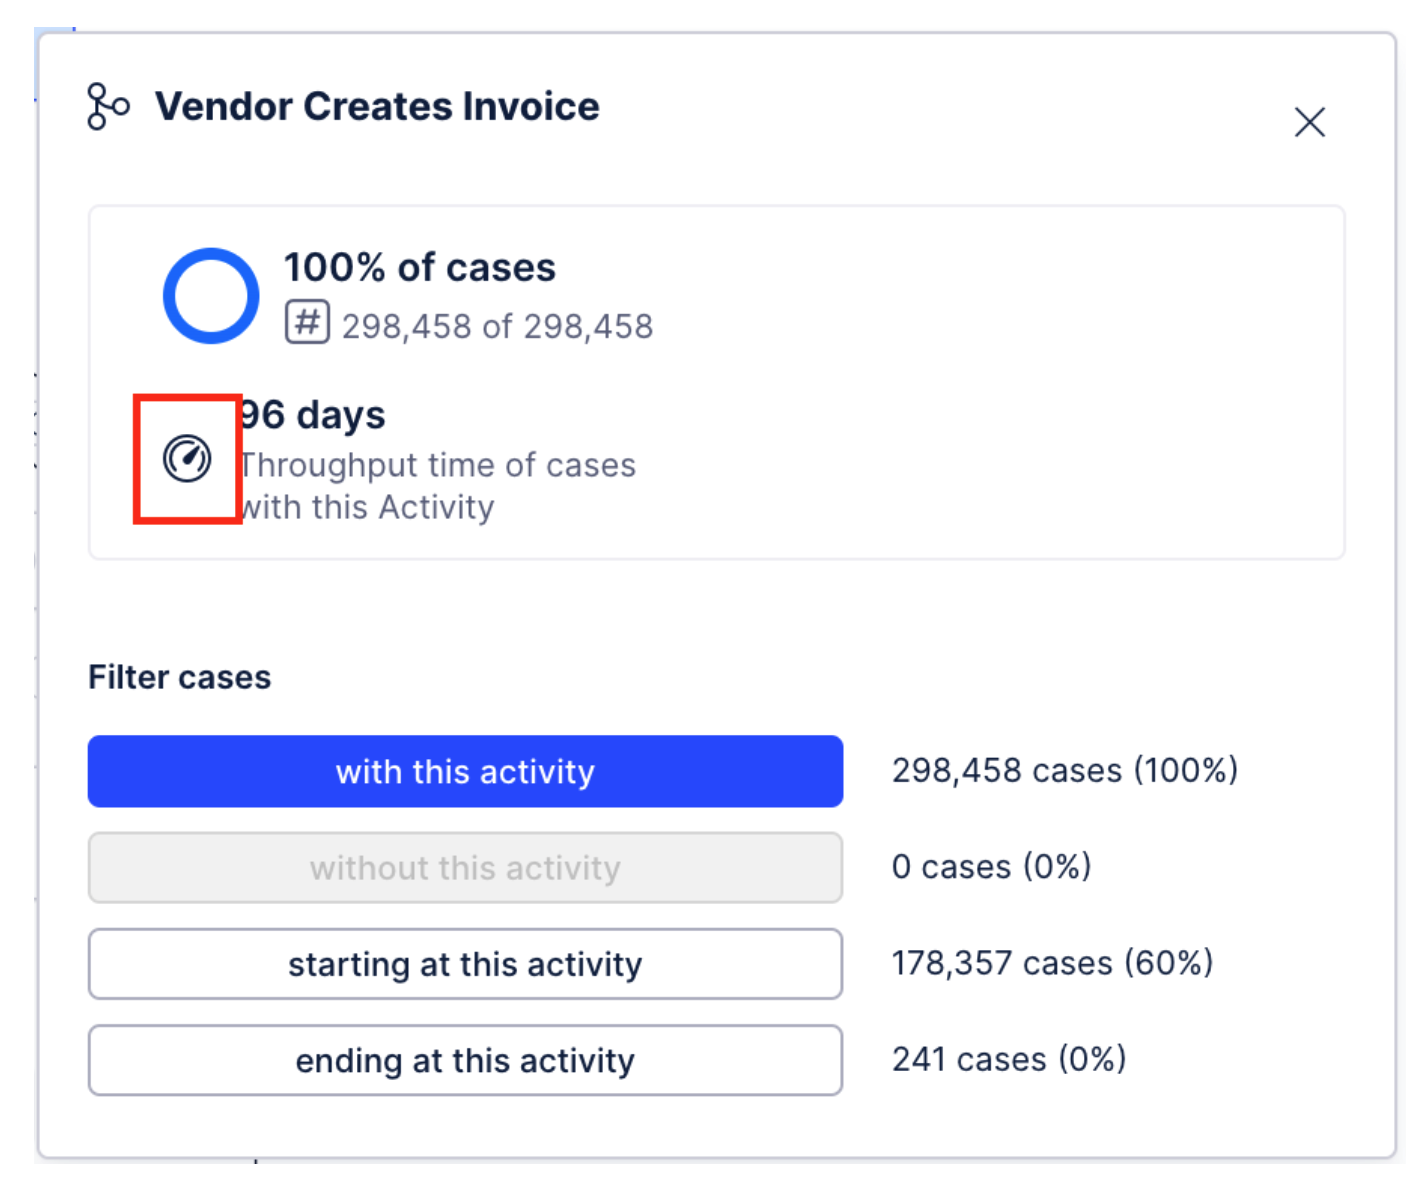
icon | false | To represent the KPI on the node/edge in the process graph and the node/edge pop-ups when the user clicks on them.
| ||
alertMetrics (object) | false | Object (see required attributes below) | To display alerts on activities and connections in the process graph. |
You can configure alerts on activities/connections which will be based on the KPIs in the KPI View. This will help the end user identify inefficiencies in the process without manually exploring the process by themselves.
Attribute | Required | Type | Description | |
|---|---|---|---|---|
Id | true | Free text | A technical identifier used for unique reference | |
pql | true | PQL | The logic needed to apply alerts on the activities/connections should be defined here in PQL. The end user will see alerts based on numeric value computed. Note: As of now, only top 5 activities/connections with the highest value will have alerts.
| |
message | true | Free text | The message configured here will be displayed on the activities/connections where the alert is visible |