Setting up custom monitoring
By enabling custom monitoring, you can collect monitoring data in a dedicated data pool. This dedicated monitoring data pool allows you to leverage Studio views to monitor your data pipelines.
For a video overview of how you can set up custom monitoring for your data pipeline:
After enabling custom monitoring, a data pool titled 'Monitoring Pool' is automatically generated. In this data pool, the system events of your data integration service are collected in four tables, each serving a different use case:
Data consumption
Data Job executions
Data model loads
Replication Cockpit executions
Difference between the monitoring data pool and other data pools
The monitoring data pool includes pre-configured transformation tasks and data models to make the data available for analysis. While you can edit the transformation tasks in the monitoring data pool, it differs from other data pools in the following ways:
The monitoring data pool doesn't allow any data intake, meaning that data connections, file uploads, data transfer imports, replication cockpit, streaming cockpit, and extractor builder are all disabled for this data pool.
The data consumption listed in your monitoring data pool is not included in your utilization storage and is excluded from your data model license calculations.
The monitoring data pool can't be copied or exported.
You aren't able to copy versions into the monitoring data pool or from the monitoring data pool to another.
The monitoring data pool fits ready-to-use Studio views that can be downloaded from the Marketplace. See: Installing custom monitoring views.
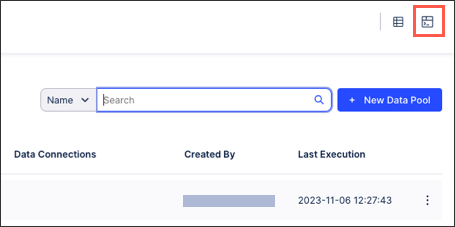
As an admin, you can set up custom monitoring from your data pool overview screen.
Click Data - Data Integration.
Click Monitoring.
Click Enable Custom Monitoring.
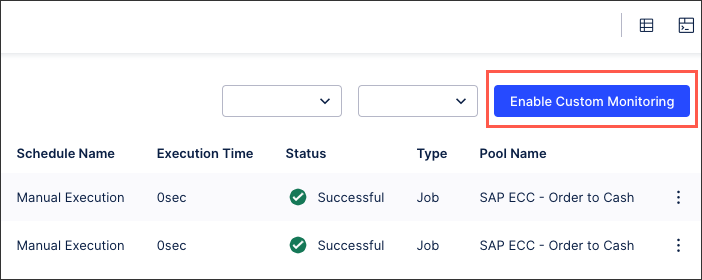
A new data pool named “Monitoring Pool” is created and automatically fed the data pipeline logs. If you previously enabled custom monitoring and a monitoring data pool already exists, that existing data pool will continue to be used to store logs and no new data pool is created.
Note
The tables of the custom data pipeline monitoring are created with the first events captured after enabling this feature. As such, no past data integration events are captured.
The data_consumption_updated_events table is created with the first APC calculation for the team, which can take several days. Until then, the "Data Consumption Monitoring" data job will fail.
The replication_execution_finished_events table is created with your first Replication Cockpit Execution. If the Replication Cockpit is not set up, the “Replication Cockpit Monitoring" data job will fail.
Disabling custom monitoring
You can disable your custom monitoring at any time by returning to the Monitoring overview screen and clicking Disable custom monitoring:
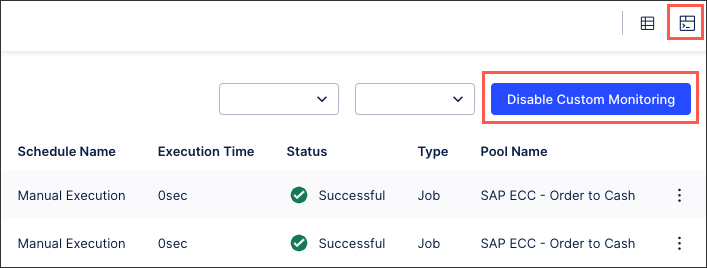 |
When you disable custom monitoring, monitoring events are no longer pushed to the monitoring data pool. The monitoring data pool is automatically not deleted, however.
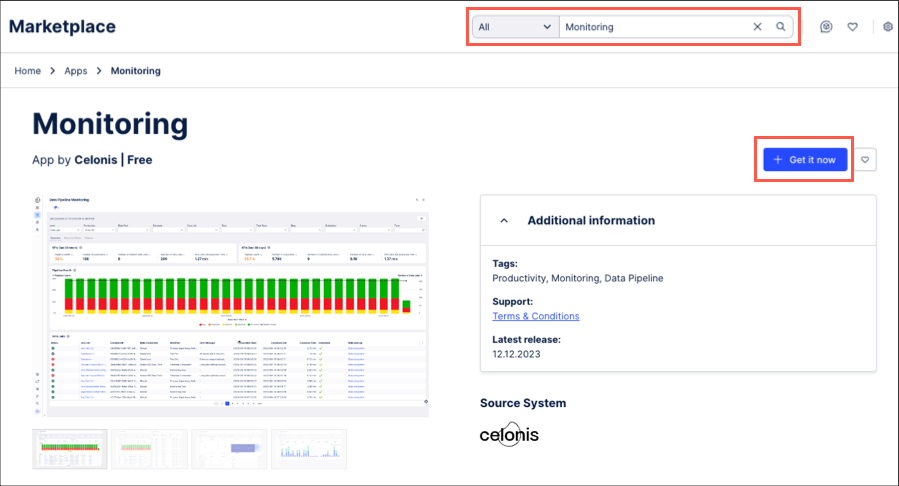
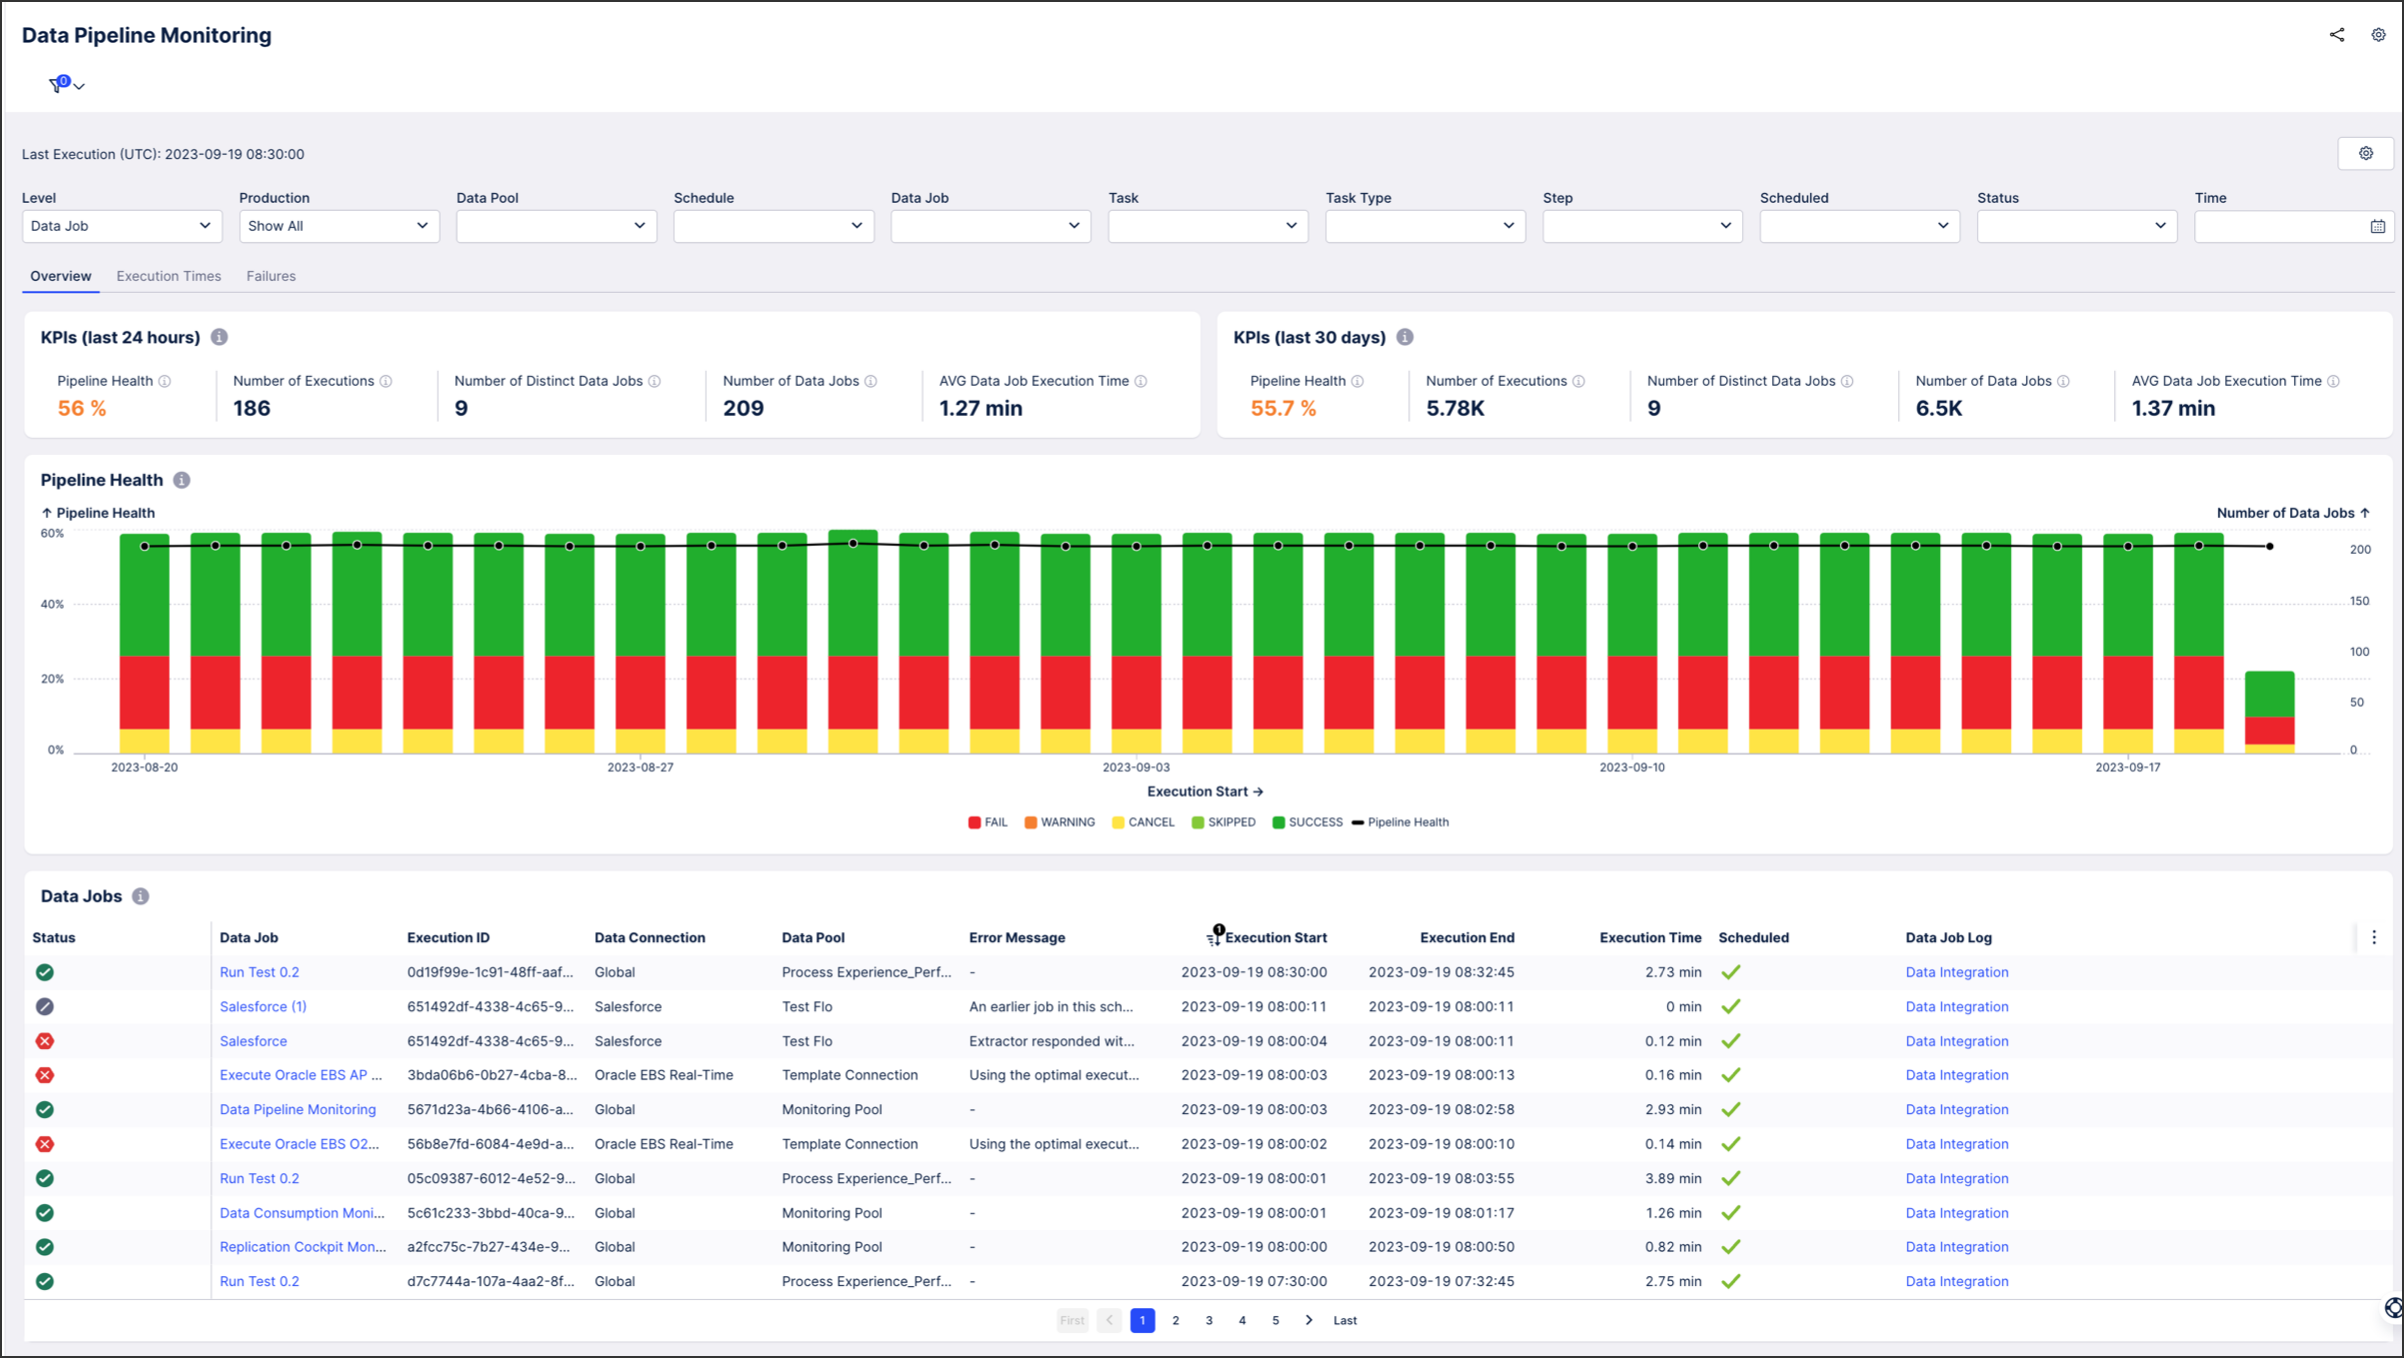
After enabling custom monitoring, you can then install the Monitoring application from the Celonis Marketplace. This provides you with ready-to-use Studio views, acting as a dashboard for your data integration monitoring.
To install your custom monitoring views:
Click Marketplace.
Search for the Monitoring application and click + Get it now.
Either select an existing Studio space to install this application to or create a new Studio space.
For more information about Studio spaces, see: Spaces.
The monitoring application is installed and your chosen Studio space is displayed. At this stage, the data model associated with the monitoring data pool hasn't been loaded, so you'll see errors in the view.
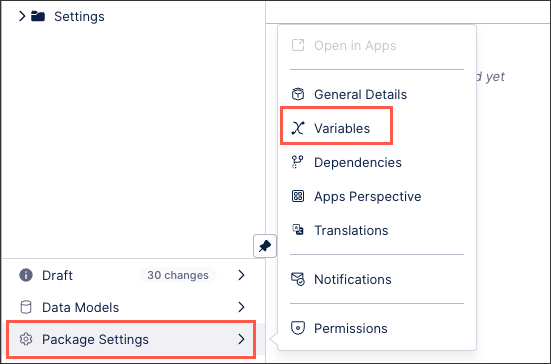
Click Package Settings - Variables.
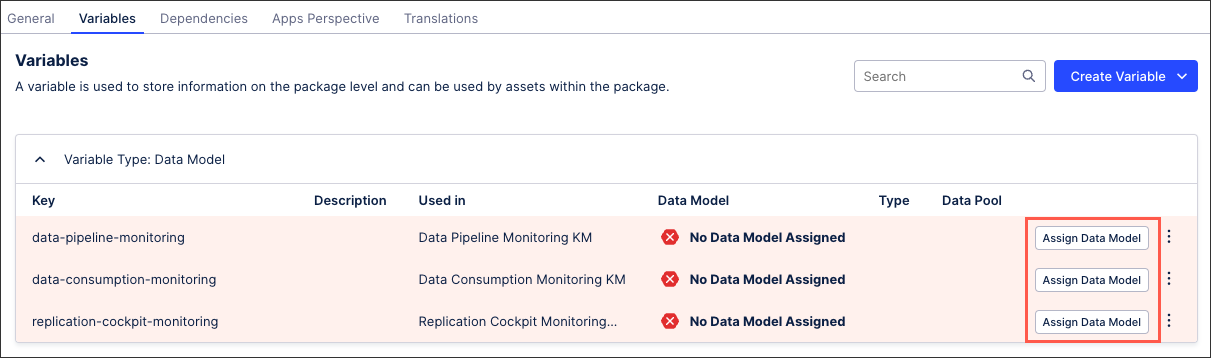
For each of the data model variables listen, click Assign data model and select the monitoring data model you want to use.
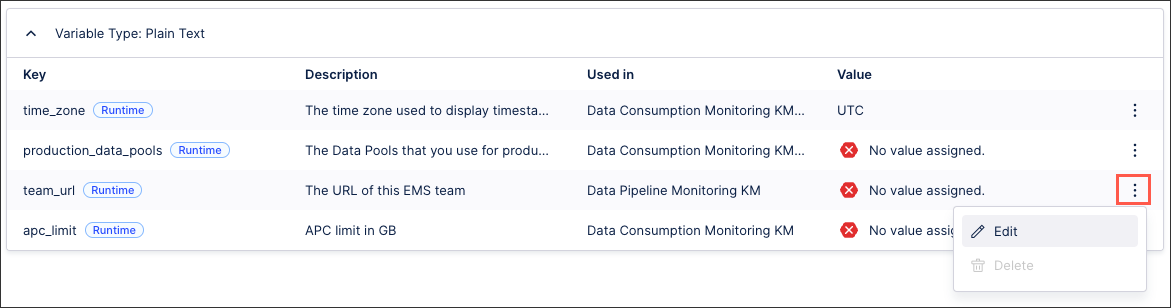
Update the apc_limit and team_url variables which store your team’s APC limit (if applicable) and your team’s URL. These variables are used in the monitoring views to correctly display your teams’ APC usage as percentage and to provide a direct link from the monitoring views to the execution logs in data integration.
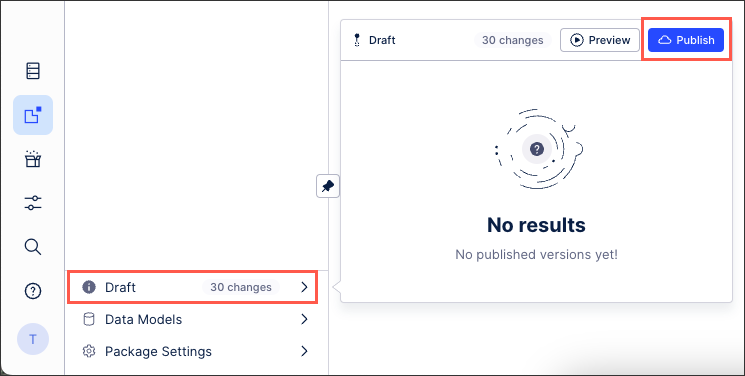
When you're ready to use your views productively, click Draft - Publish.
Click Apps on the main menu and view your newly configured monitoring application.
When configuring your custom monitoring, consider the following options:
Data periods based on parameters
Using data pool parameters, you can limit the data set that is part of each Data Model load, such that the Data Model load times stay constant.
The period length can be adjusted on a Data Model level in the Data Pool Parameters section, which can be accessed from the Monitoring Data Pool:
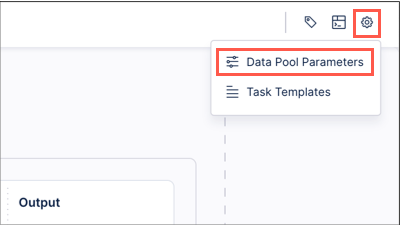 |
The following table illustrates the assignment of the different Data Pool parameters to different Data Jobs and Data Models, as well as their default values.
Data Pool Parameter | Placeholder | Description | Type | Data Type | Default Value | Unit | Used in |
|---|---|---|---|---|---|---|---|
Time Span Data Consumption Monitoring | TIME_SPAN_DATA_CONSUMPTION | The period of data to be processed in the Data Consumption Monitoring Transformations and Data Model Load. | Private | Integer | 90 | days | Data Consumption Monitoring |
Time Span Data Pipeline Monitoring | TIME_SPAN_DATA_PIPELINE | The period of data to be processed in the Data Pipeline Monitoring Transformations and Data Model Load. | 30 | Data Pipeline Monitoring | |||
Time Span Replication Cockpit Monitoring | TIME_SPAN_REPLICATION_COCKPIT | The period of data to be processed in the Replication Cockpit Monitoring Transformations and Data Model Load. | 30 | Replication Cockpit Monitoring |
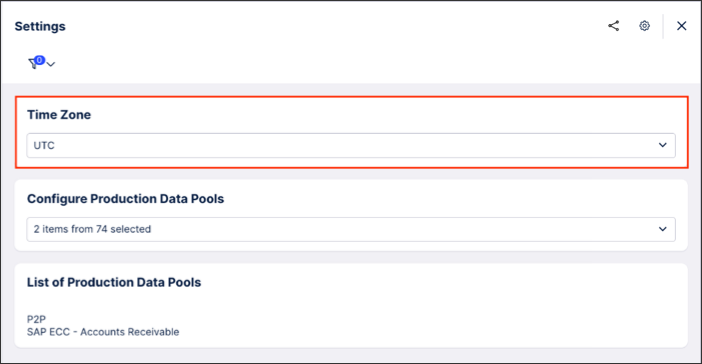
Time zones
You can configure the time zone visible in the Monitoring Views to match the time zone in the rest of the platform, such as in the execution logs in Data Integration. You can configure the time zone through the Settings view, which is accessible from all Monitoring assets. The time zone is automatically applied to all Monitoring assets and is managed at the team level.
 |
Note
The Time Zone setting in the Monitoring views is not connected to the time zone that you can configure in your profile settings which are stored for each user.
Production data pools
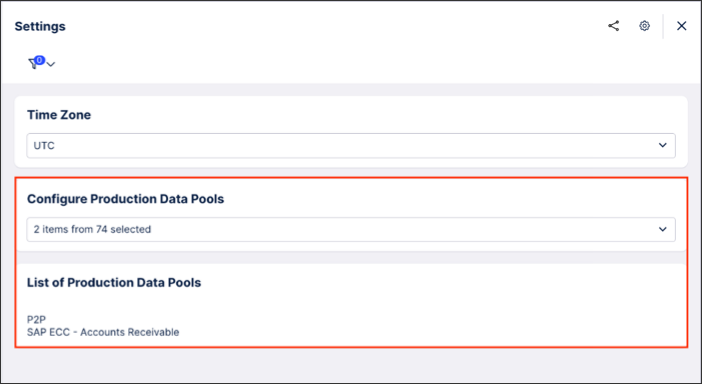
To quickly drill down on the Data Pools you use for your productive use cases, this filter option allows you to select all Data Pools or just the ones used productively.
You can view and modify the list of Data Pools that you use productively in the Settings view. The list of productive Data Pools is shared across all Monitoring Views and filters by name. So if you rename a Data Pool, you will have to update the list of Monitoring Views accordingly.
 |