Configuring a sankey diagram in legacy views
Legacy view component
You're currently viewing a topic about a legacy view component in Studio. This component can still be used in legacy Studio views, however we recommend using the visual view editor in the new Studio experience. The updated interface includes drag and drop capabilities, allowing you to easily add components and configure your views.
For more information, see: Views.
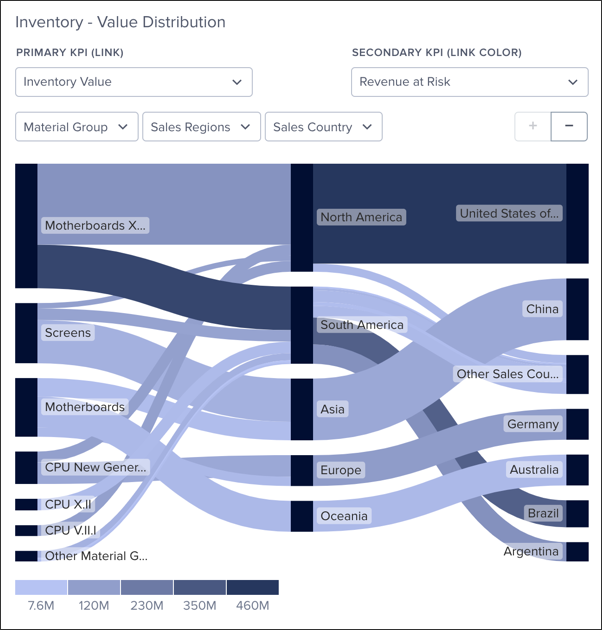
Sankey diagrams are used to show weighted networks, i.e. flows. They can be used to visualize Source to End connections: For a total amount, the diagram can show where it comes from and where it ends up, with possible intermediate steps. Alternatively, they can be used to visualize evolution: Nodes are duplicated in two or more groups that represent stages. Connections show the evolution between two states, similar to Chord diagrams.
Basic sankey diagram configuration
To configure a basic sankey diagram, the following attributes are available:
Property | Type | Description |
|---|---|---|
showConfig | true | false | Enable the selection of KPIs in the component. |
And the YAML example for this configuration:
id: value-distribution-sankey
type: sankey
settings:
  name: Inventory - Value Distribution
  showConfig: true
  maxCategories: 7
  dimensions:
    - attribute: MATERIAL_GROUP_NAME_DEMO
    - attribute: PLANT_CONTINENT_NAME
    - attribute: PLANT_COUNTRY_NAME
  kpis:
    - kpi: INVENTORY_VALUE_COUNTRY
      type: primary
      default: true
    - kpi: REVENUE_AT_RISK_TREEMAP
      type: primary
    - kpi: INVENTORY_VALUE_COUNTRY
      type: secondary
    - kpi: REVENUE_AT_RISK_TREEMAP
      type: secondary
      default: true