Charts & Tables in Process Adherence Manager
The Charts & Tables panel on the right side of the Process Adherence Manager screen allows you to pin the most relevant information in order to access it quickly. The Charts & Tables panel is not part of the canvas, but can be shown or hidden by clicking the Charts & Tables symbol at the top of the panel.
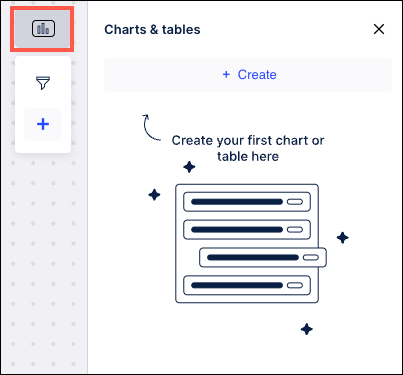
Initially, there are no charts or tables displayed in the panel, but you can use the instructions in the Adding a Chart or Table section to begin creating charts and tables. Once charts and tables have been added to the panel, you can use the drag-and-drop method to arrange them within the panel.
These charts and tables are limited to showing only the properties for an object or event, as well as the corresponding histograms or charts.