Studio app building guidelines - Process Explorer
The Process Explorer component uses event logs to visualize business processes. It is at the heart of process discovery and a good start into any new project. Working with the process explorer can bring users from “zero to process mining” and gives them unparalleled transparency into the process flow. While a business user may already understand how a process is mapped and works, seeing this process flow based on real event data helps them investigate potential root causes and see improvement opportunities.
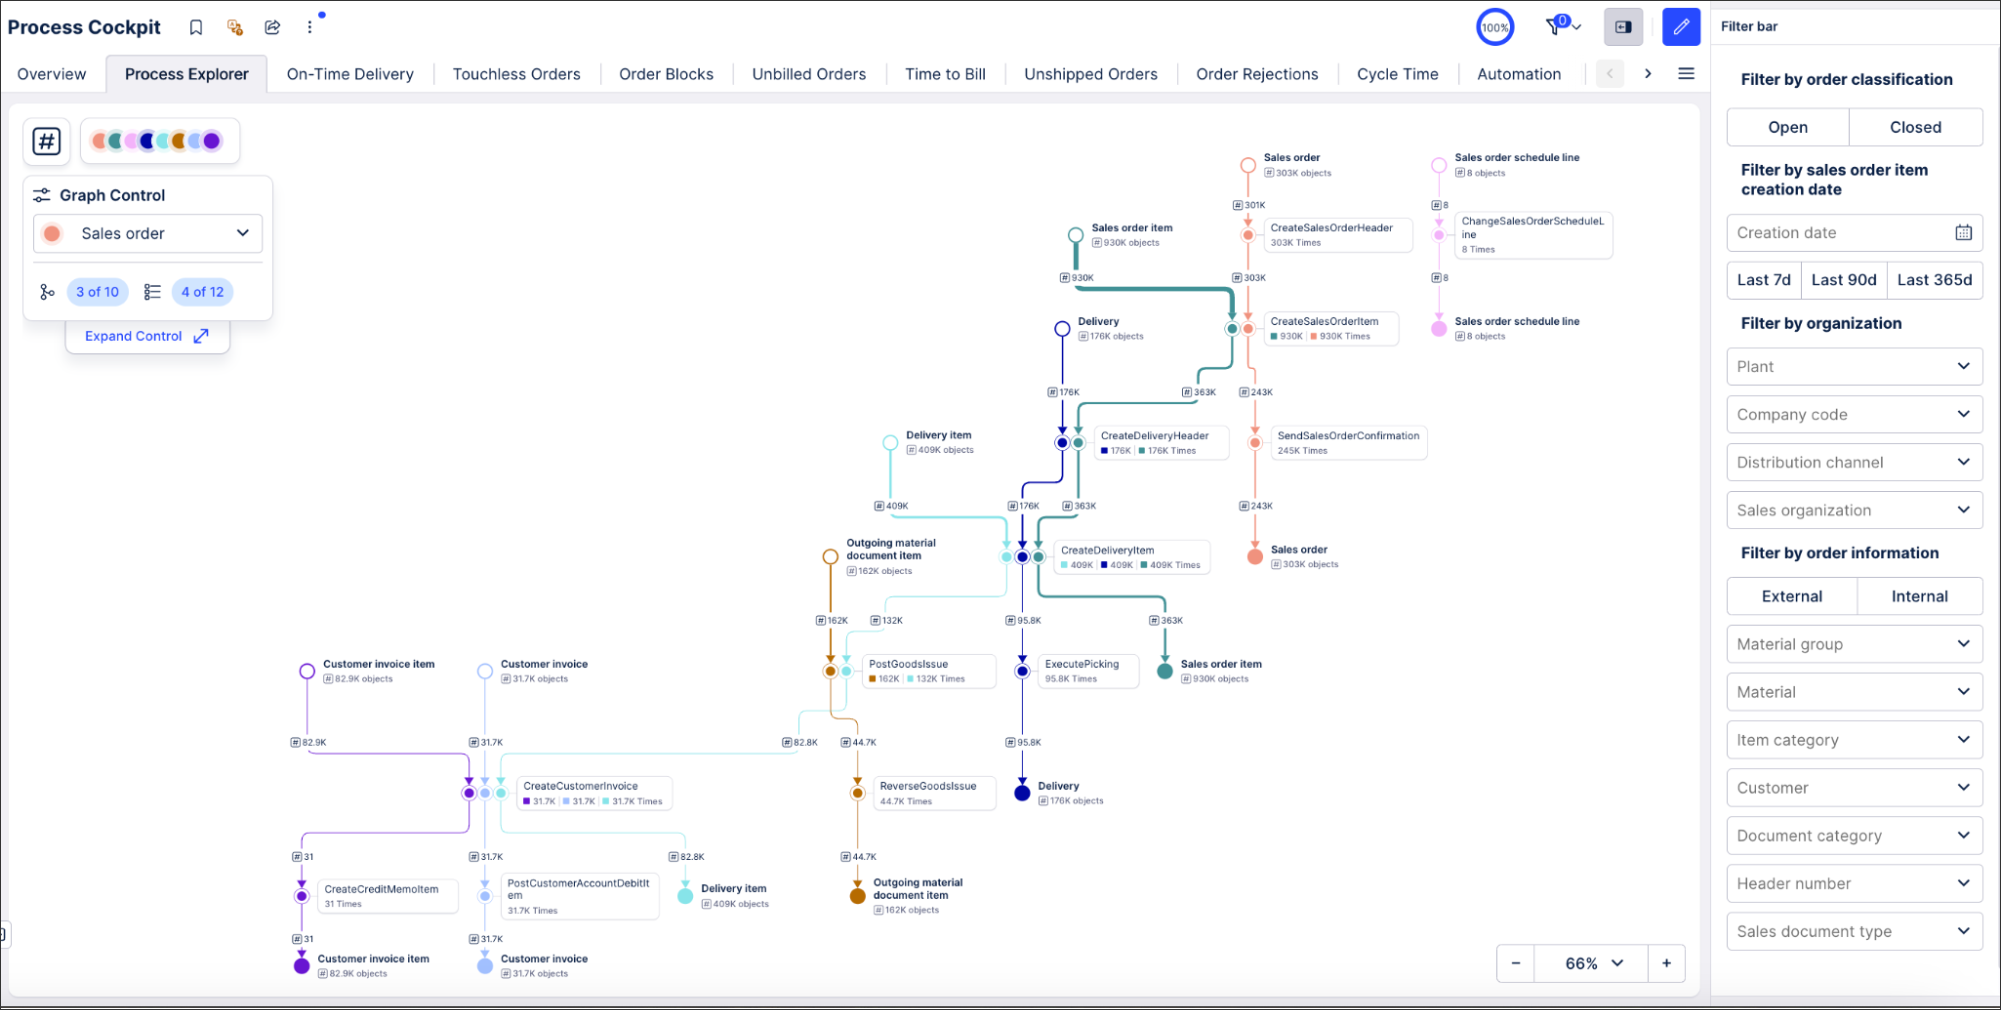
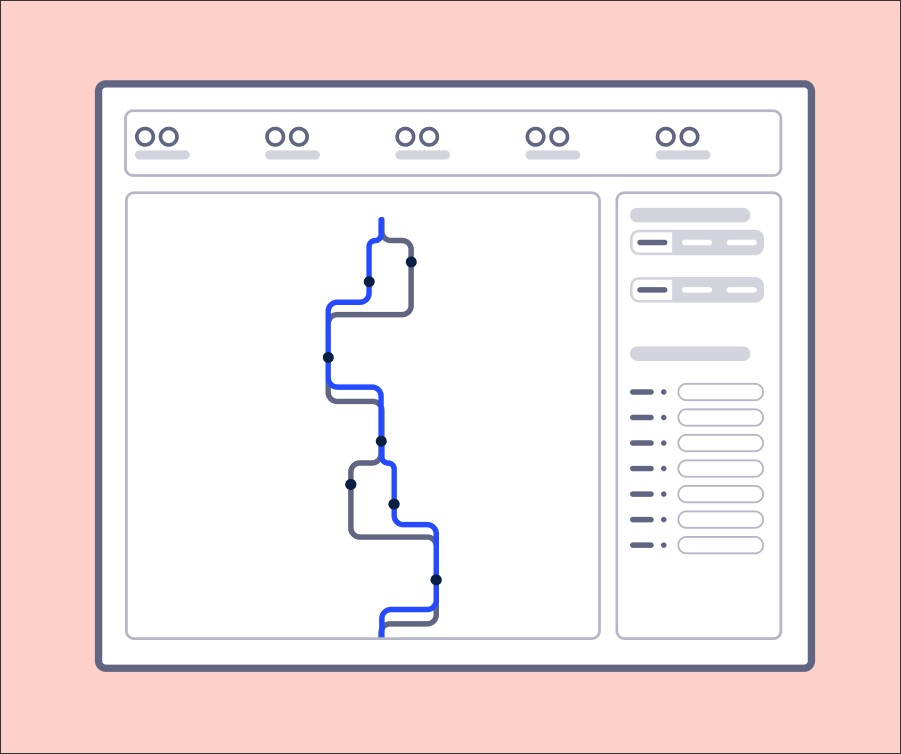
An example of the Process Explorer in action can be found in any Starter Kit in the Process Cockpit view. This screenshot is from the Process Explorer tab in the Order Management Starter Kit (object-centric).
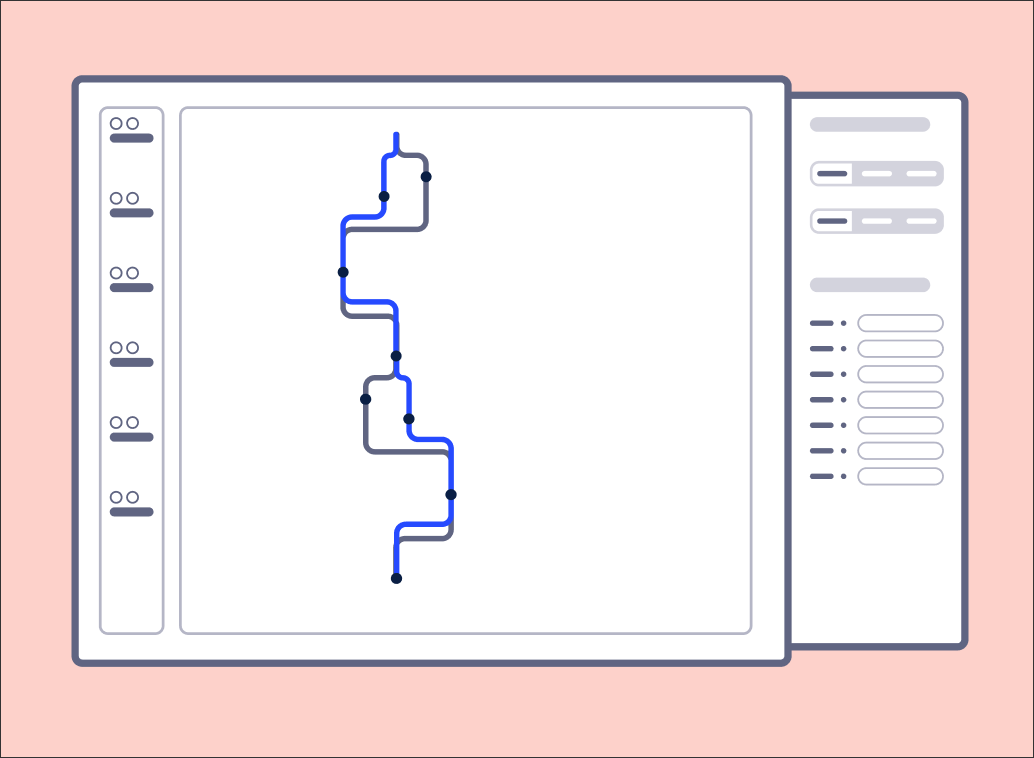
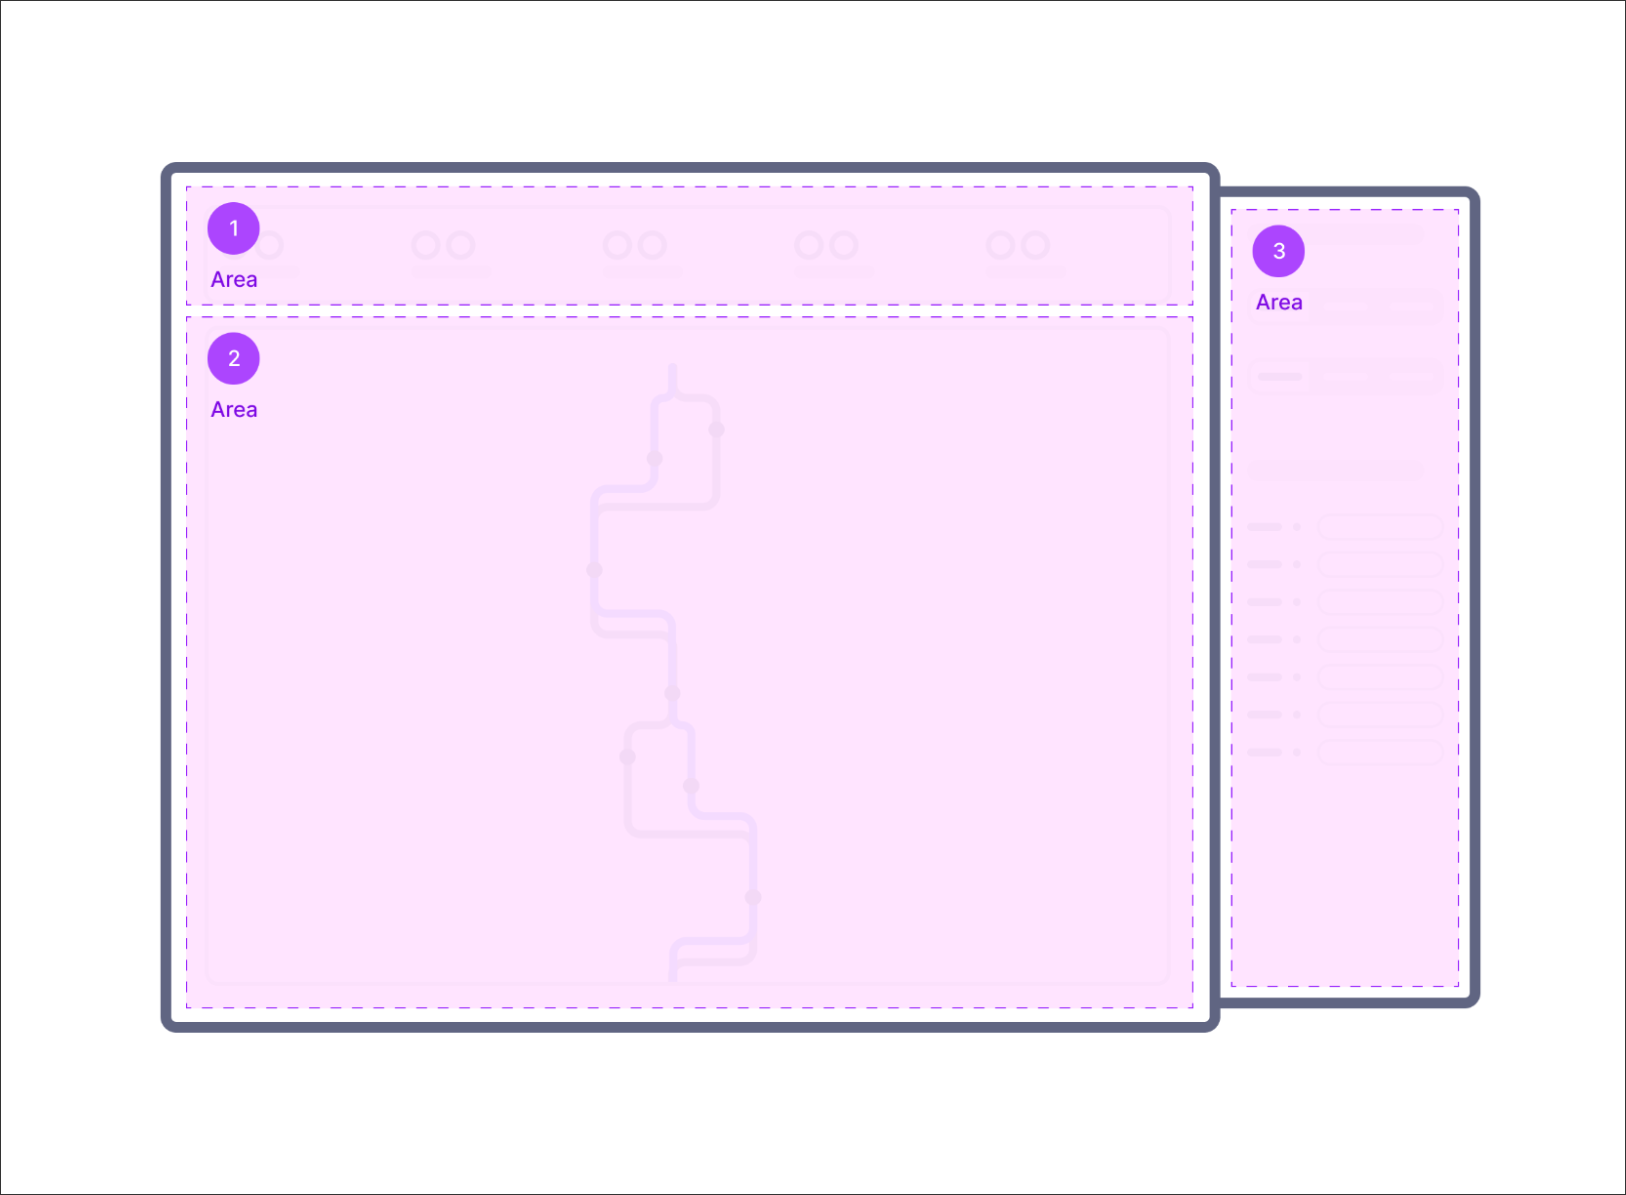
A Process Explorer View or View tab consists of 3 sections:
 |
This view can then be created using a combination of Studio components:
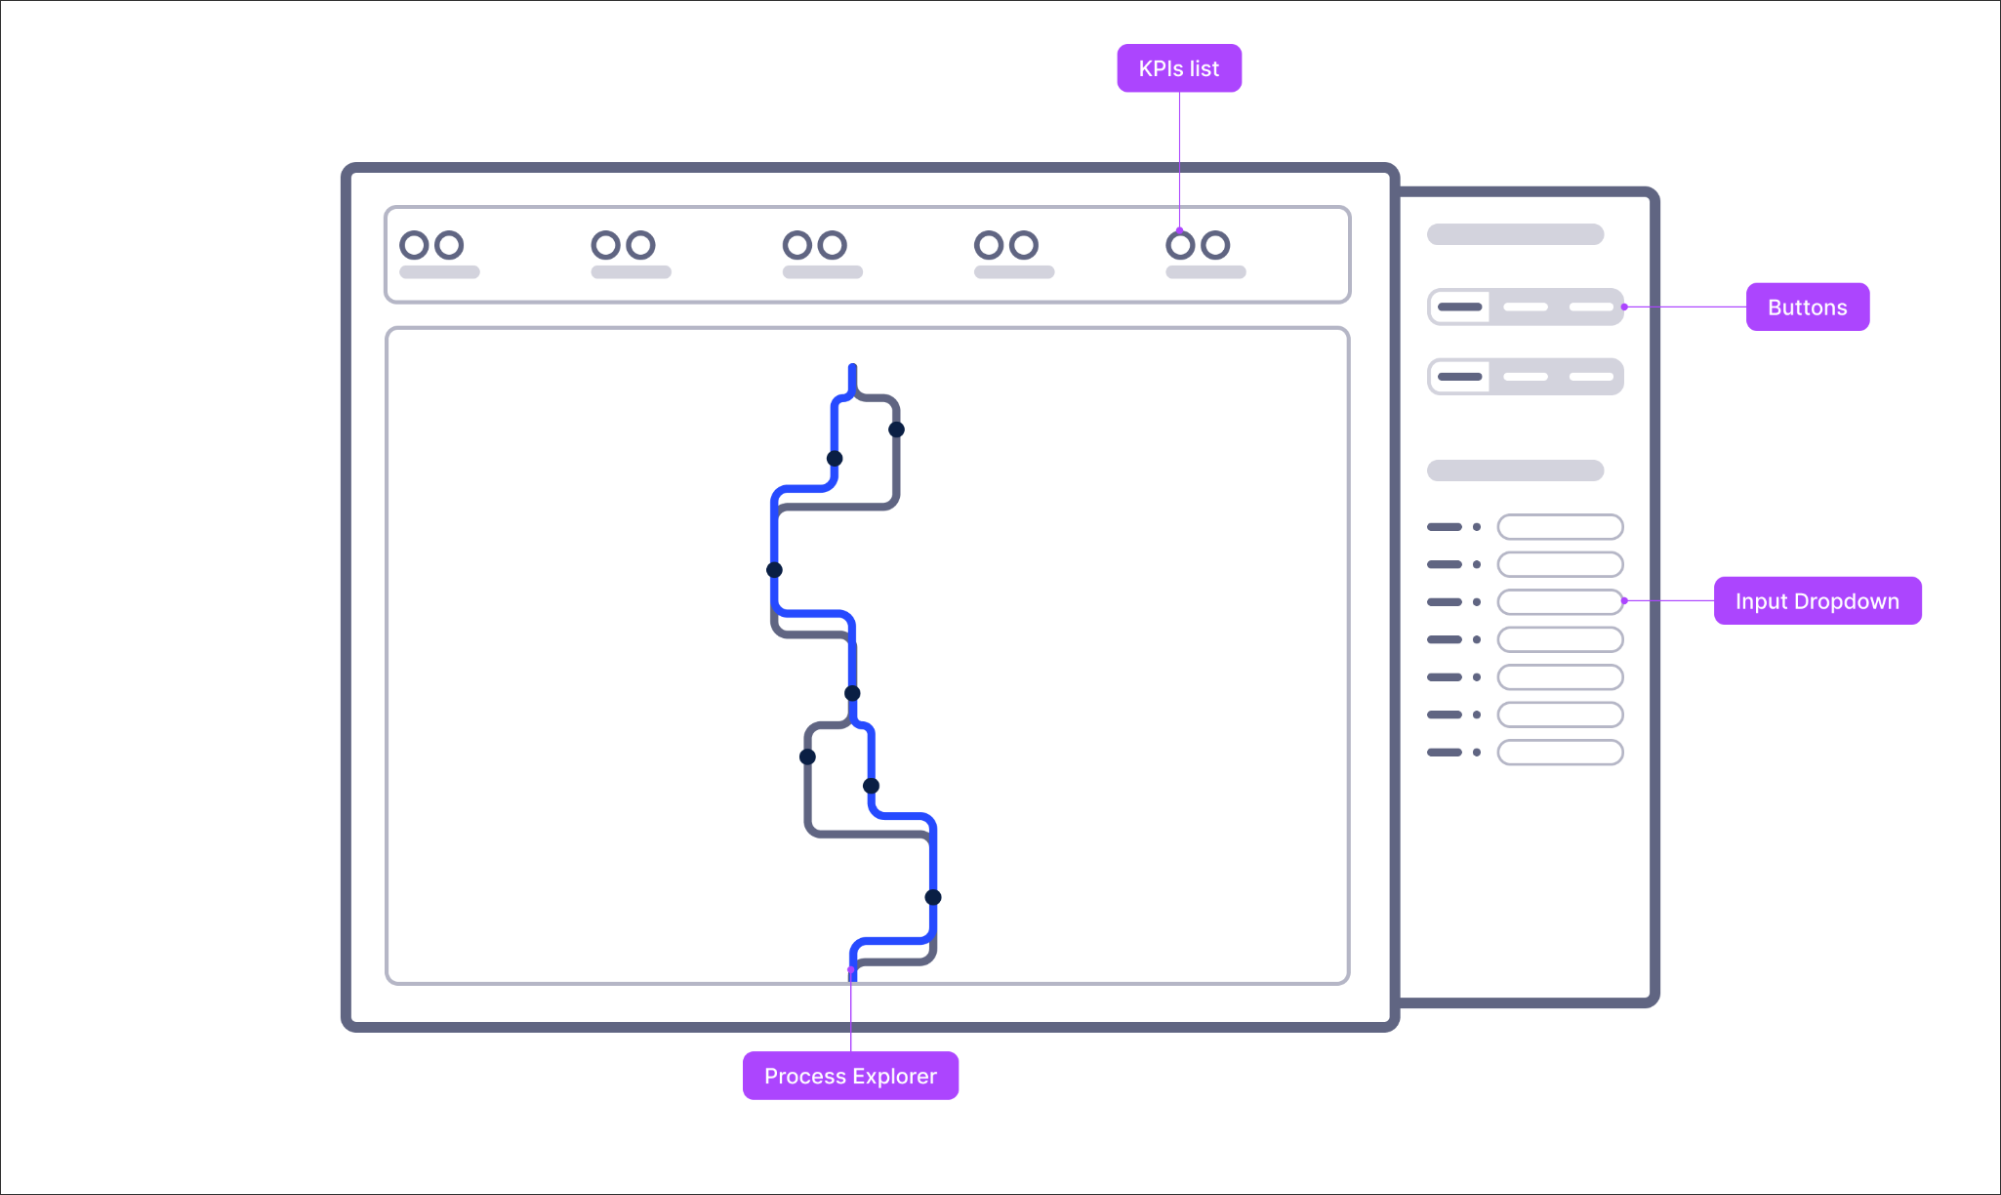 |
KPI section (1)
On top of the View, we suggest adding a small number of core metrics. These should include the number of cases (e.g. # Sales Orders or # Sales Order items) and the total value of cases. This allows the business user to see at first glance the scope of the analysis in case they apply filters to the View.
The Process Explorer allows out of the box filtering capabilities such as “Start from activity” or “End with activity”. Applying this filter will then also influence the KPIs on top so the user could see easily what is the most common start or end activity.
Tip
Adding a monetary metric helps business users to understand the implications of the scope.
Main section with Process Explorer component (2)
The Process Explorer component is the main part of this View. This component uses event logs (single or the relationship between multiple event logs if you're using an object-centric Data Model)) to visualize business processes.
The Process Explorer allows for customization options. We suggest using the “slider” configuration. The slider is easier to use for a ‘generic’ exploratory approach and therefore, would be more appropriate to be configured for the business user since they do not need a pre-defined hypothesis to get started with their analysis.
Tip
The KPIs in Process Explorer are calculated differently depending on the graph control (panel or slider).
We also recommend always allowing the business end user to switch between KPIs displayed in the process explorer. The event count is often a good starting point but you can decide to switch to another default KPI.
To learn more about configuring the Process Explorer component in Studio, see: Configure Process Explorer in views.
Filter bar (3)
As in every View, you can set-up a collapsible filter bar for this View. It allows the end user to see the process under different scenarios (e.g. filtered by certain object attributes). The filter bar can be collapsed if the user is not actively using it so that they can fully focus on the process visualization and don’t lose space. The filters applied would also affect the scope KPIs on top of the View. In this way, all three sections are connected. Through the scale-to-fit set-up, all of them are visible and accessible at the same time.
More information on how to configure the filter bar, see: Configuring a filter bar for your View.
When creating your Process Explorer Views, we recommend the following:
If you work with an object-centric Data Model, you can easily add multiple event logs to the process explorer component. Still, try not to overload your end users and ensure you are deciding on key objects to be displayed.
You can guide your business users when it comes to choosing the right KPIs in the Process Explorer, e.g. with descriptions or info text. We recommend the median throughput time over the average throughput time since it is less prone to outliers.
We'd also discourage the following:
Adding too many filters on the View. Instead, use the built-in collapsible filter bar instead of adding the filter components on the main grid. This allows the Process Explorer to scale to its fullest depending on the available screen size. Using the in-built filterbar also allows you to share it between tabs so setting up the filtering options is a lot easier for you as a builder.
Using vertical KPIs. We recommend putting the scope KPIs on the top of the View so the users see at a glance at which data set they look at.