Configuration Options for Custom Monitoring
New data integration content available
You're currently viewing a data integration topic that has been replaced and will eventually be removed from our documentation.
For the latest data integration content, see: Data Integration.
Data Period
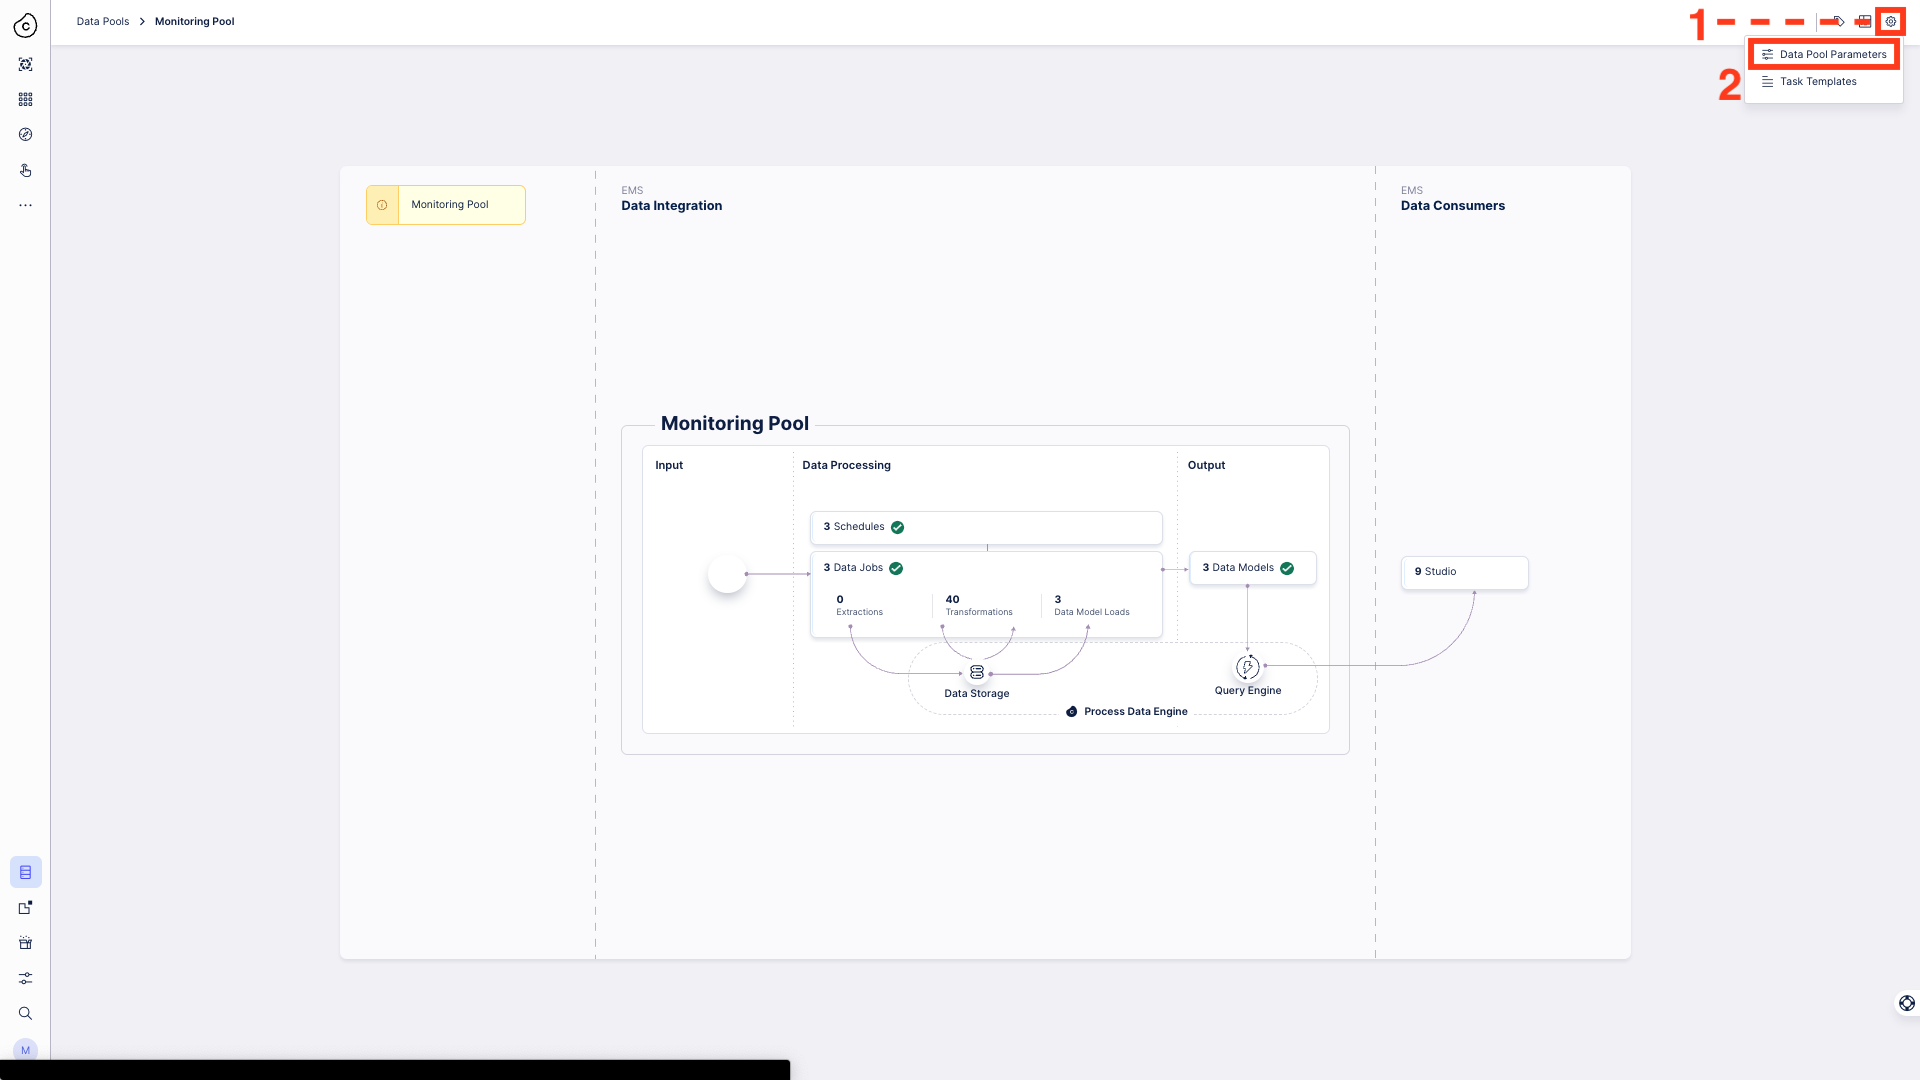
To ensure long-term performance, we introduced Data Pool Parameters to the Monitoring Pool in version 2.0.0. These parameters limit the data set that is part of each Data Model load, such that the Data Model load times stay constant. The period length can be adjusted on a Data Model level in the Data Pool Parameters section, which can be accessed from the Monitoring Data Pool.
 |
The following table illustrates the assignment of the different Data Pool parameters to different Data Jobs and Data Models, as well as their default values.
Data Pool Parameter | Placeholder | Description | Type | Data Type | Default Value | Unit | Used in |
|---|---|---|---|---|---|---|---|
Time Span Data Consumption Monitoring | TIME_SPAN_DATA_CONSUMPTION | The period of data to be processed in the Data Consumption Monitoring Transformations and Data Model Load. | Private | Integer | 90 | days | Data Consumption Monitoring |
Time Span Data Pipeline Monitoring | TIME_SPAN_DATA_PIPELINE | The period of data to be processed in the Data Pipeline Monitoring Transformations and Data Model Load. | 30 | Data Pipeline Monitoring | |||
Time Span Replication Cockpit Monitoring | TIME_SPAN_REPLICATION_COCKPIT | The period of data to be processed in the Replication Cockpit Monitoring Transformations and Data Model Load. | 30 | Replication Cockpit Monitoring |
Time zone
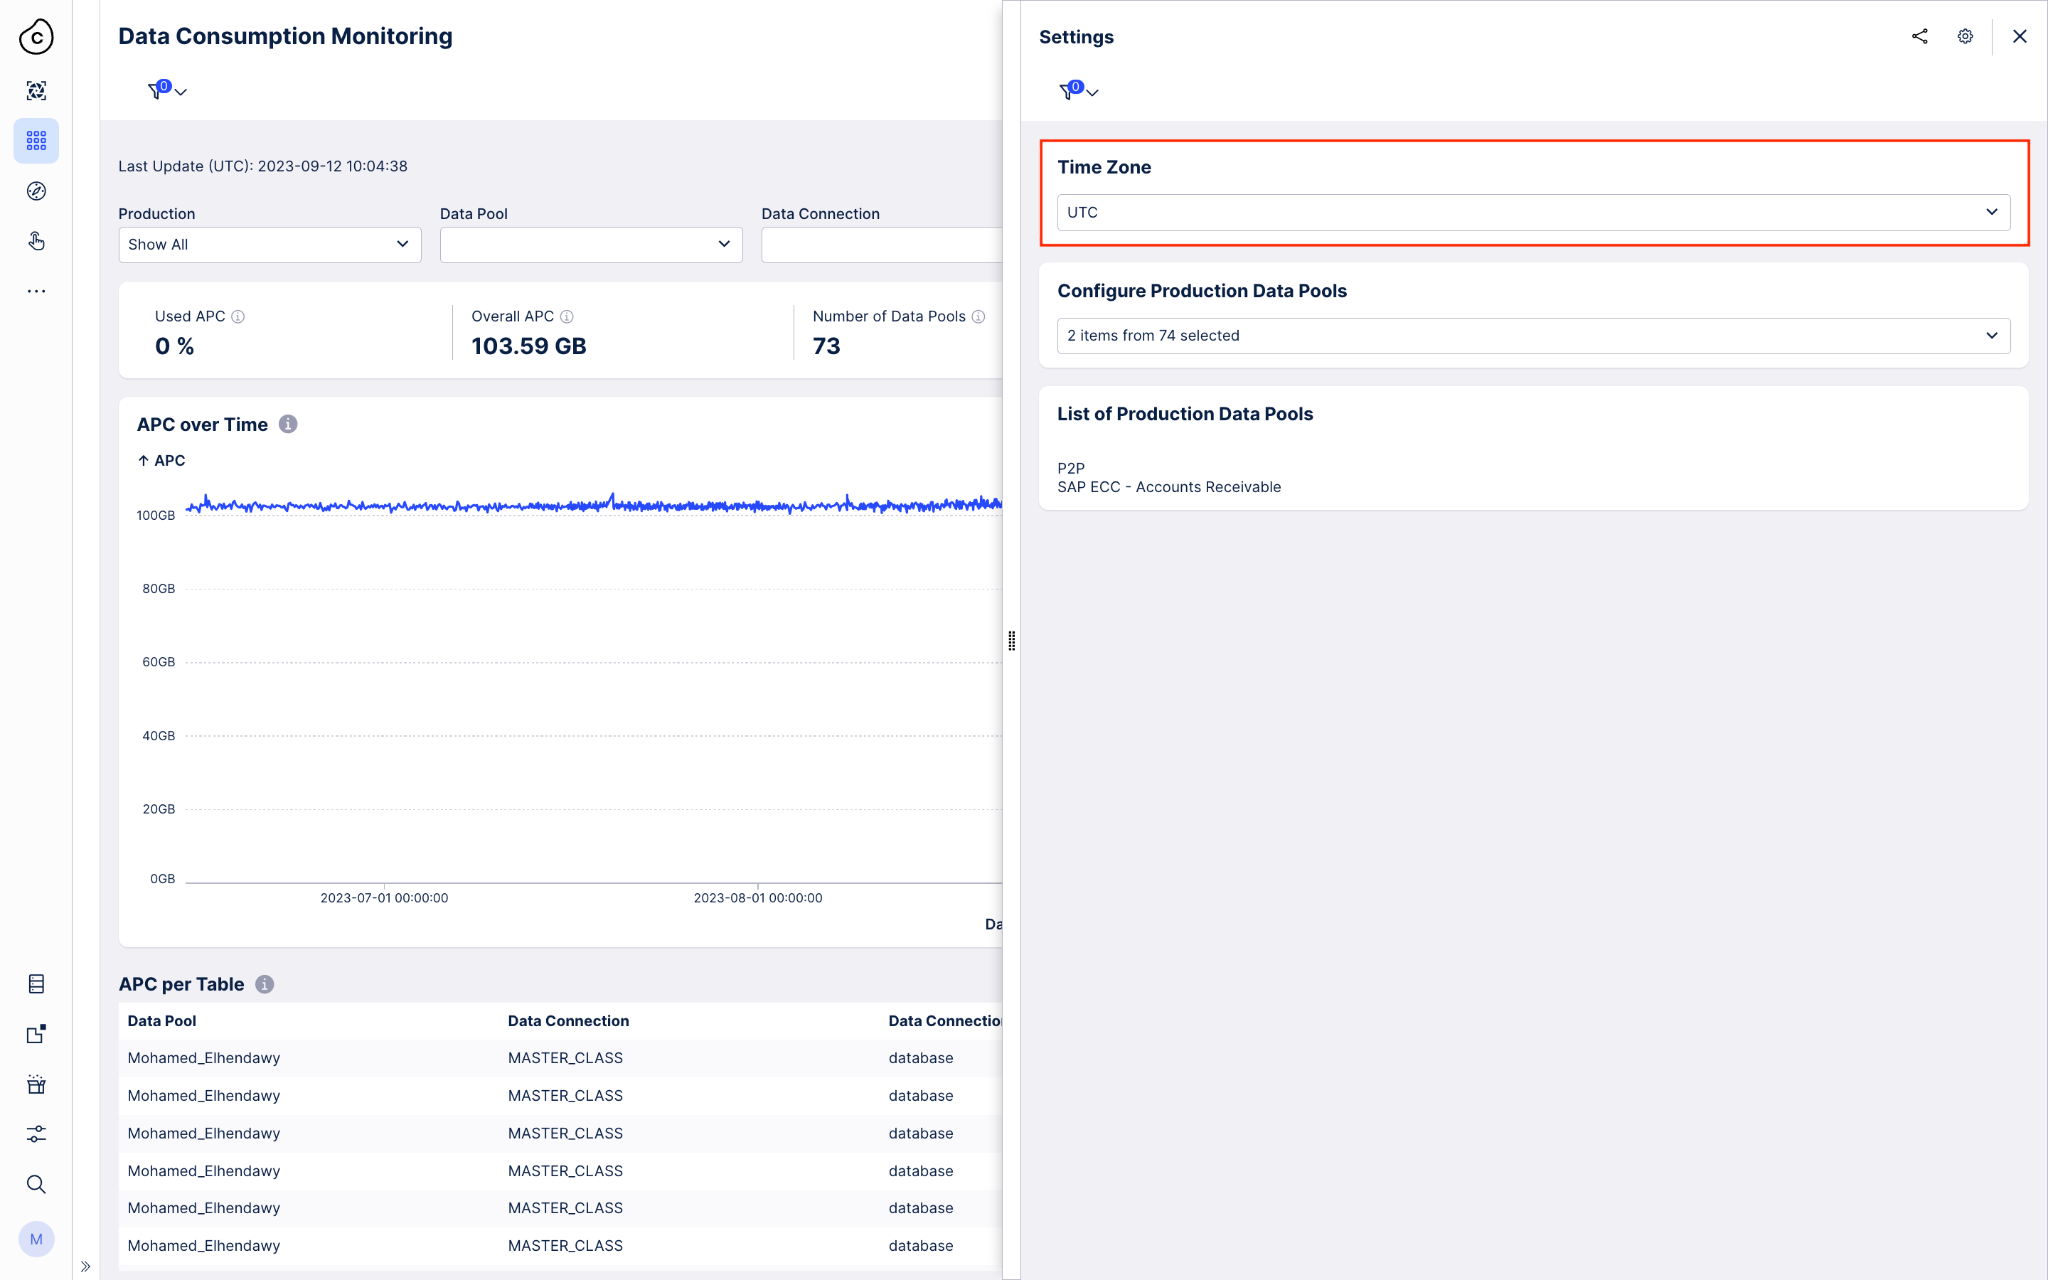
To account for the multiple time zones that our customers work from and which can be configured in the UI, we introduced time zone support to the Monitoring Views. This feature allows you to configure the time zone visible in the Monitoring Views to match the time zone in the rest of the platform, such as in the execution logs in Data Integration. You can configure the time zone through the Settings view, which is accessible from all Monitoring assets. The time zone is automatically applied to all Monitoring assets and is managed at the team level.
Note
The Time Zone setting in the Monitoring views is not connected to the time zone that you can configure in your profile settings which are stored for each user.
 |
Production Data Pools
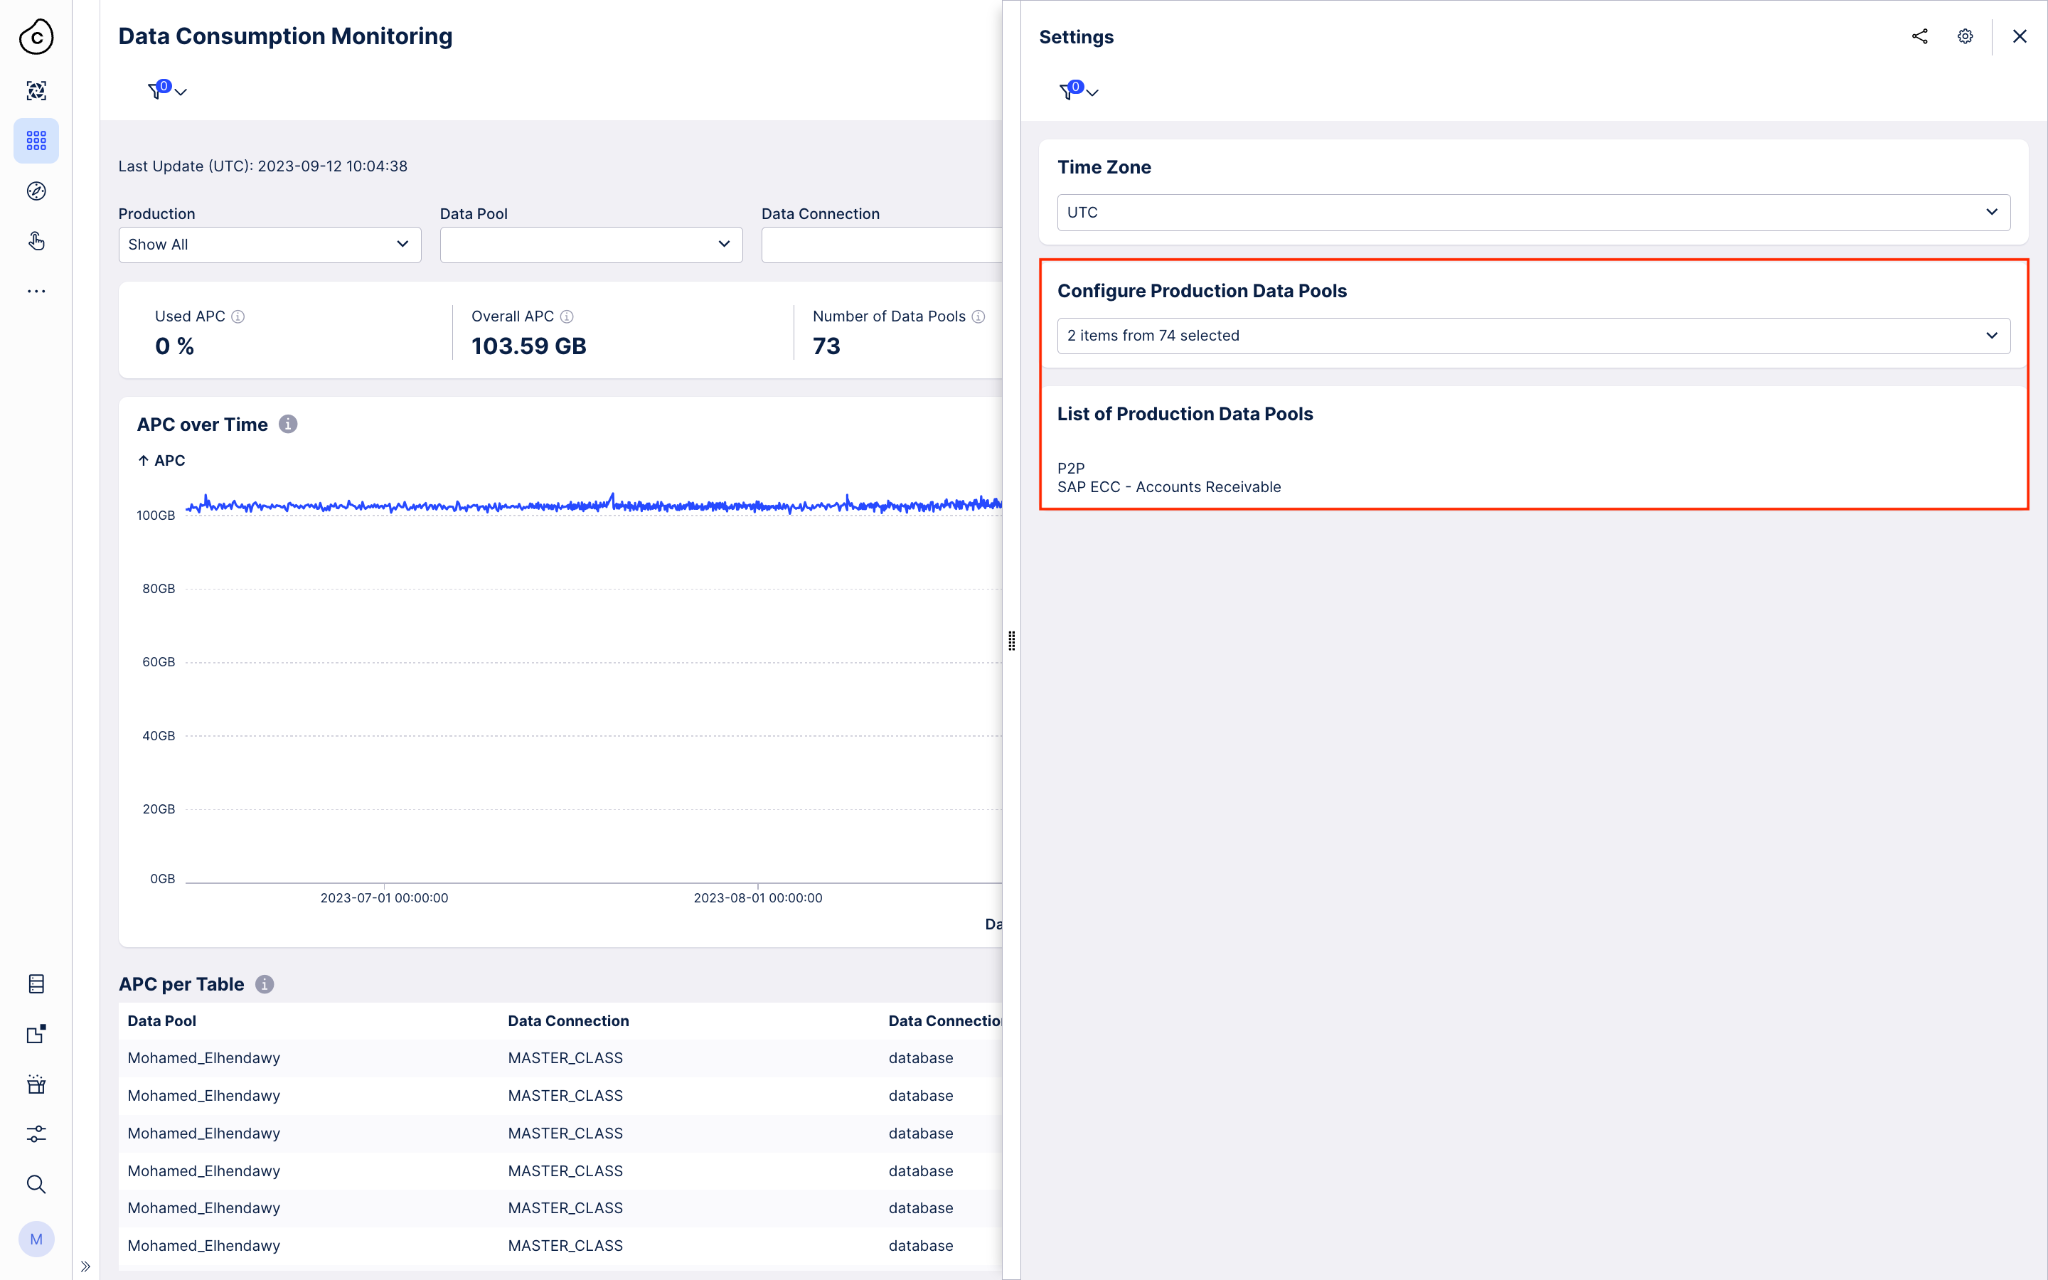
To quickly drill down on the Data Pools you use for your productive use cases, this filter option allows you to quickly select all Data Pools or just the ones used productively. You can view and modify the list of Data Pools that you use productively in the Settings view. The list of productive Data Pools is shared across all Monitoring Views and filters by name. So if you rename a Data Pool, you will have to update the list of Monitoring Views accordingly.
 |