Monitoring of Data Pools
New data integration content available
You're currently viewing a data integration topic that has been replaced and will eventually be removed from our documentation.
For the latest data integration content, see: Data Integration.
The Monitoring section helps you to get an overview of all Data Job executions within a team across Data Pools. You can access the Monitoring section by clicking on the Monitoring icon in the upper right corner of Data Integration.
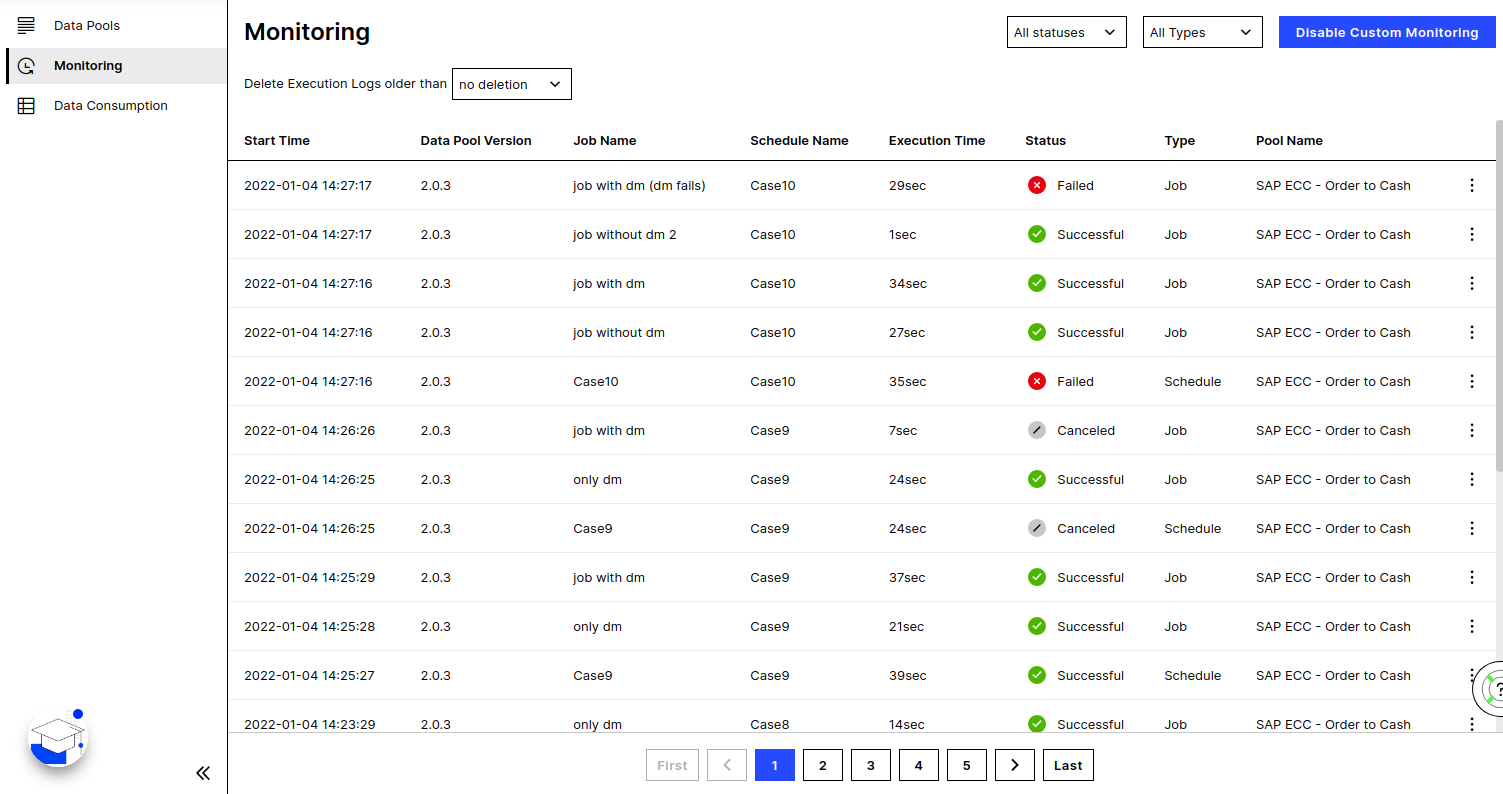 |
List of Data Job executions
The list contains information about all executed Data Jobs:
Start time: The start time of the schedule or Data Job execution.
Data Pool Version: Data Pool Version of the execution.
Job name: The name of the schedule or the Data Job, depending on the entry type.
Schedule name: The name of the schedule which included the Data Job.
Execution time: The execution time of the schedule or the Data Job execution.
Status: The final status of the schedule or the Data Job execution.
Type: The log entry type, either a schedule or a Data Job.
Pool Name: The name of the Data Pool containing the schedule or the Data Job.
Clicking on one of the entries directs you to more detailed execution logs for the respective schedule or Data Job. You can use the drop-downs above to filter the list by status and execution type.
Custom Monitoring
The Custom Monitoring collects Monitoring data in a dedicated Data Pool and allows you to leverage Views to monitor your data pipelines. You can enable or disable the Custom Monitoring using the Enable/Disable Custom Monitoring button in the upper right corner of the Monitoring section. To learn more about the Custom Monitoring, click here for more details.