Data Job Log
New data integration content available
You're currently viewing a data integration topic that has been replaced and will eventually be removed from our documentation.
For the latest data integration content, see: Data Integration.
The logs display all executions of the data job together with information on the status and the execution start time.
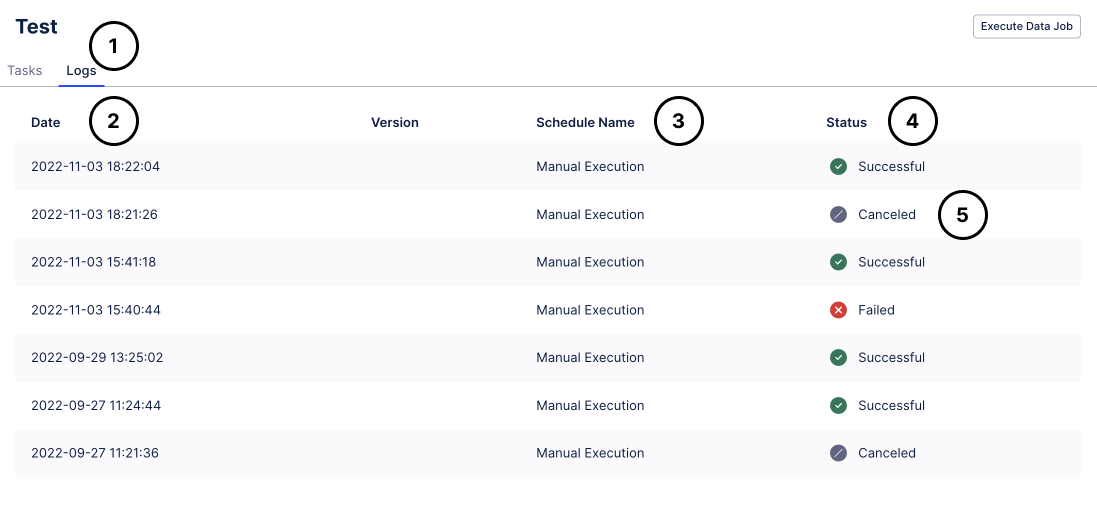 |
To access the logs of a Data Job you need to click on the "Logs" tab within a Data Job.
For every Data Job execution you see the starting date and time.
If a Data Job is executed as part Schedule you will see the name of that schedule here. If a user executes the data job manually, "Manual Execution" will be shown here.
The status of a Data Job can be one of the following:
Successful: All tasks within the job have been successfully executed.
Failed: At least one task has failed during the execution.
Canceled: The execution has been canceled before it could finish.
Running: The execution is currently running.
Queued: The execution is currently running, but it is on hold.
Skipped: The execution gets skipped as the Data Job is already running.
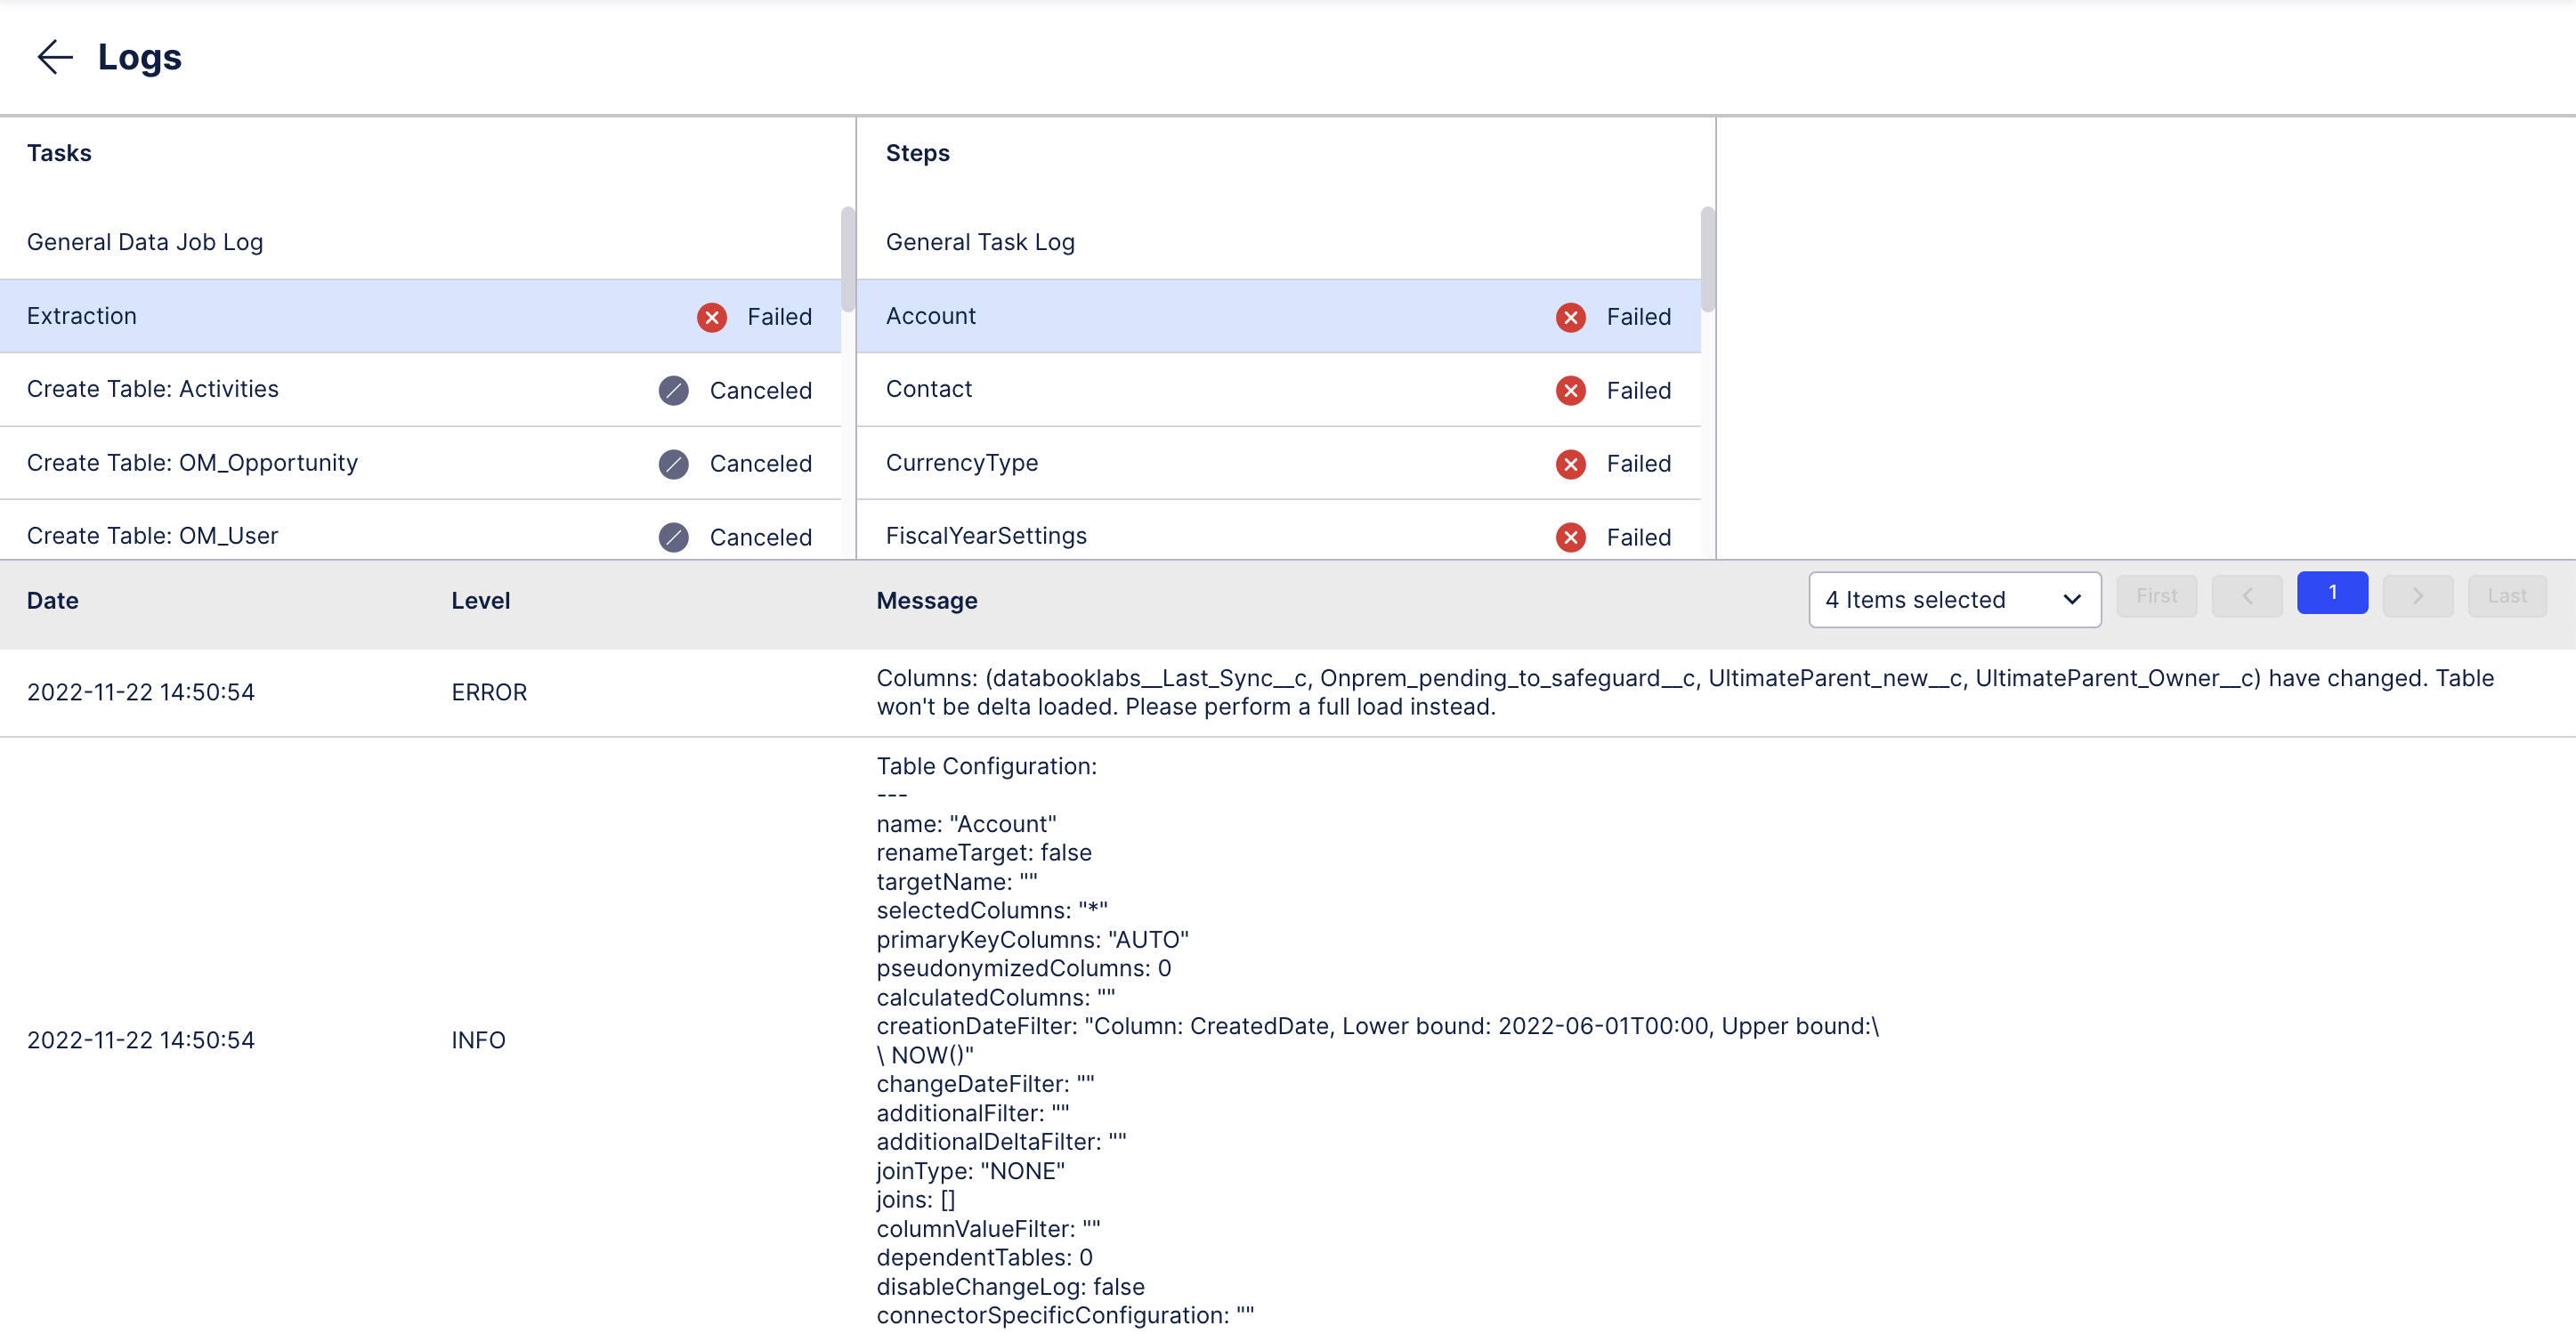
By clicking on any row/any data job execution you enter the detailed logs.
Detailed logs
 |