Execution History
New data integration content available
You're currently viewing a data integration topic that has been replaced and will eventually be removed from our documentation.
For the latest data integration content, see: Data Integration.
The Execution History shows you all Data Job executions in a Data Pool level in two categories:
Data Jobs: Covers all Data Job executions with an indicator of whether they were executed by a Schedule or manually.
Schedules: Covers all scheduled executions which can contain multiple Data Jobs.
Data Job Execution History
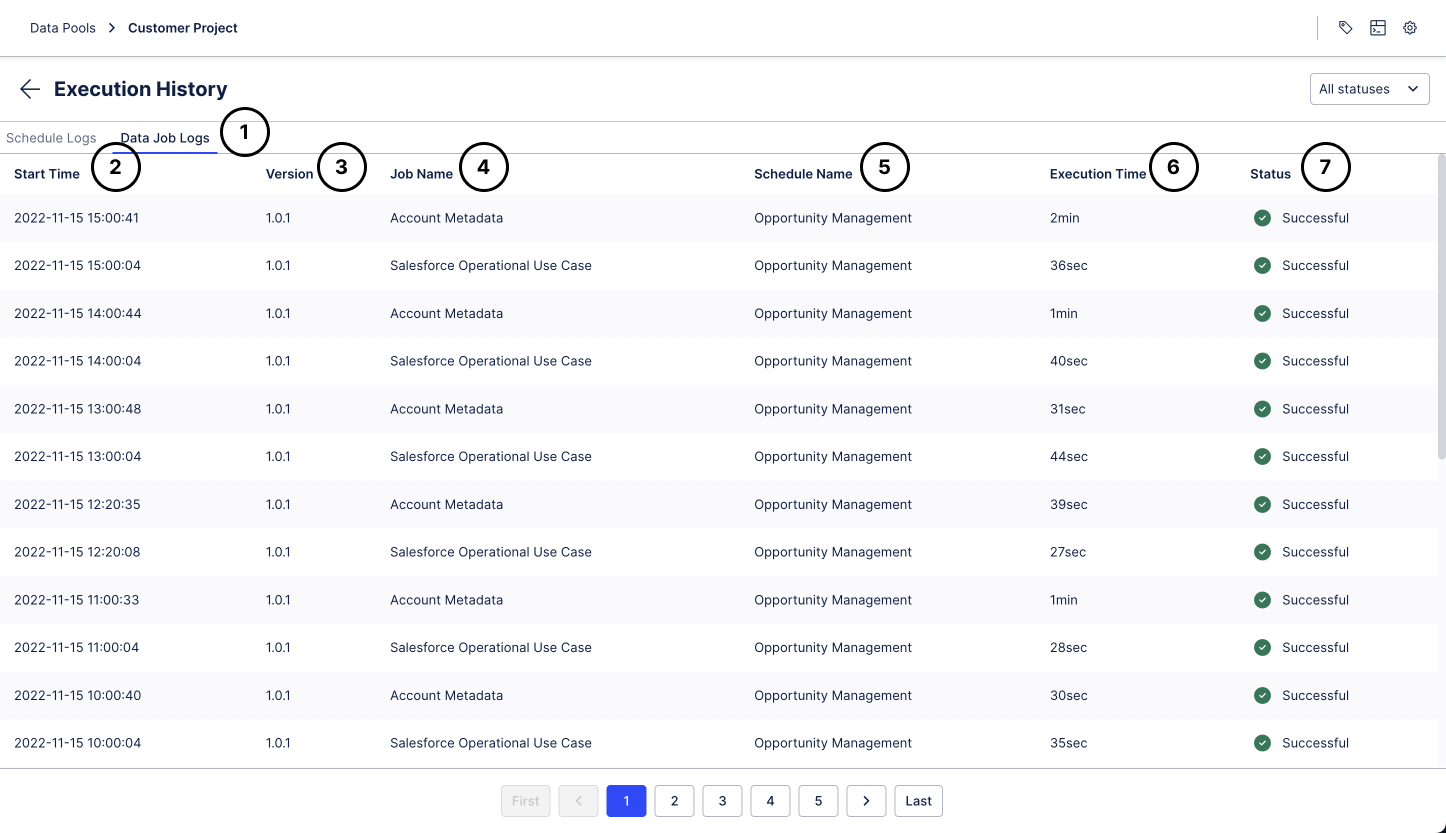 |
If you click on an entry, you will see the detailed logs of that Data Job, just as if you had accessed the logs through the Data Job itself. The pagination buttons on the bottom allow you to easily navigate through the history of executions
The Data Job Execution History is available through the Data Job Logs tab in the Execution History.
The start time of the Data Job execution
The Version of the Data Pool at the point in time the Data Job has been executed
The name of the Data Job
The name of the Schedule; "Manual Execution" if it is not executed by a Schedule
The Execution Time to complete the Data Job
The current status of the execution, see Data Job Log for details
You can use the drop-down to only see executions with a certain status
Schedule Execution History
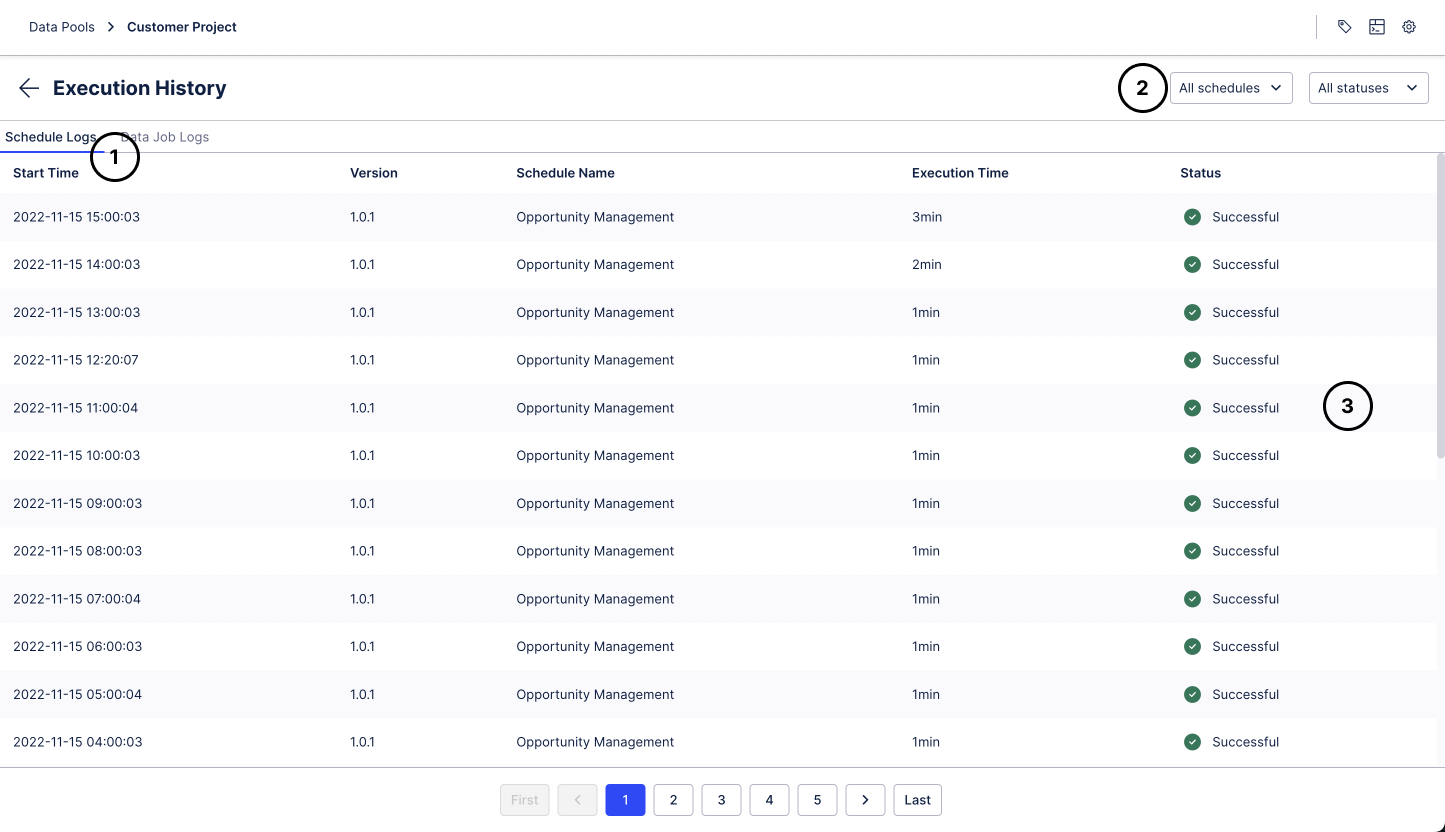 |
The Schedule Execution History is very similar to the Data Job Execution History. The only differences are that you can select the Schedule you would like to look at in a drop-down and the fact that you can see the detailed logs of all the Data Jobs within that Schedule if you click on an execution entry.
The Schedule Execution History is available through the "Schedule Logs" tab in the Execution History
The status drop-down works the same way as the one for Data Job executions. The Schedule drop-down allows you to filter the Execution History to a specific Schedule
If you click on an entry, you will see the detailed logs of all the Data Jobs within that Schedule execution