Set up Custom Monitoring
New data integration content available
You're currently viewing a data integration topic that has been replaced and will eventually be removed from our documentation.
For the latest data integration content, see: Data Integration.
The Custom Monitoring feature is only visible to Admins. If you’re an Analyst, ask a team Admin to enable it for you.
Enable Custom Monitoring
Go to Data Integration.
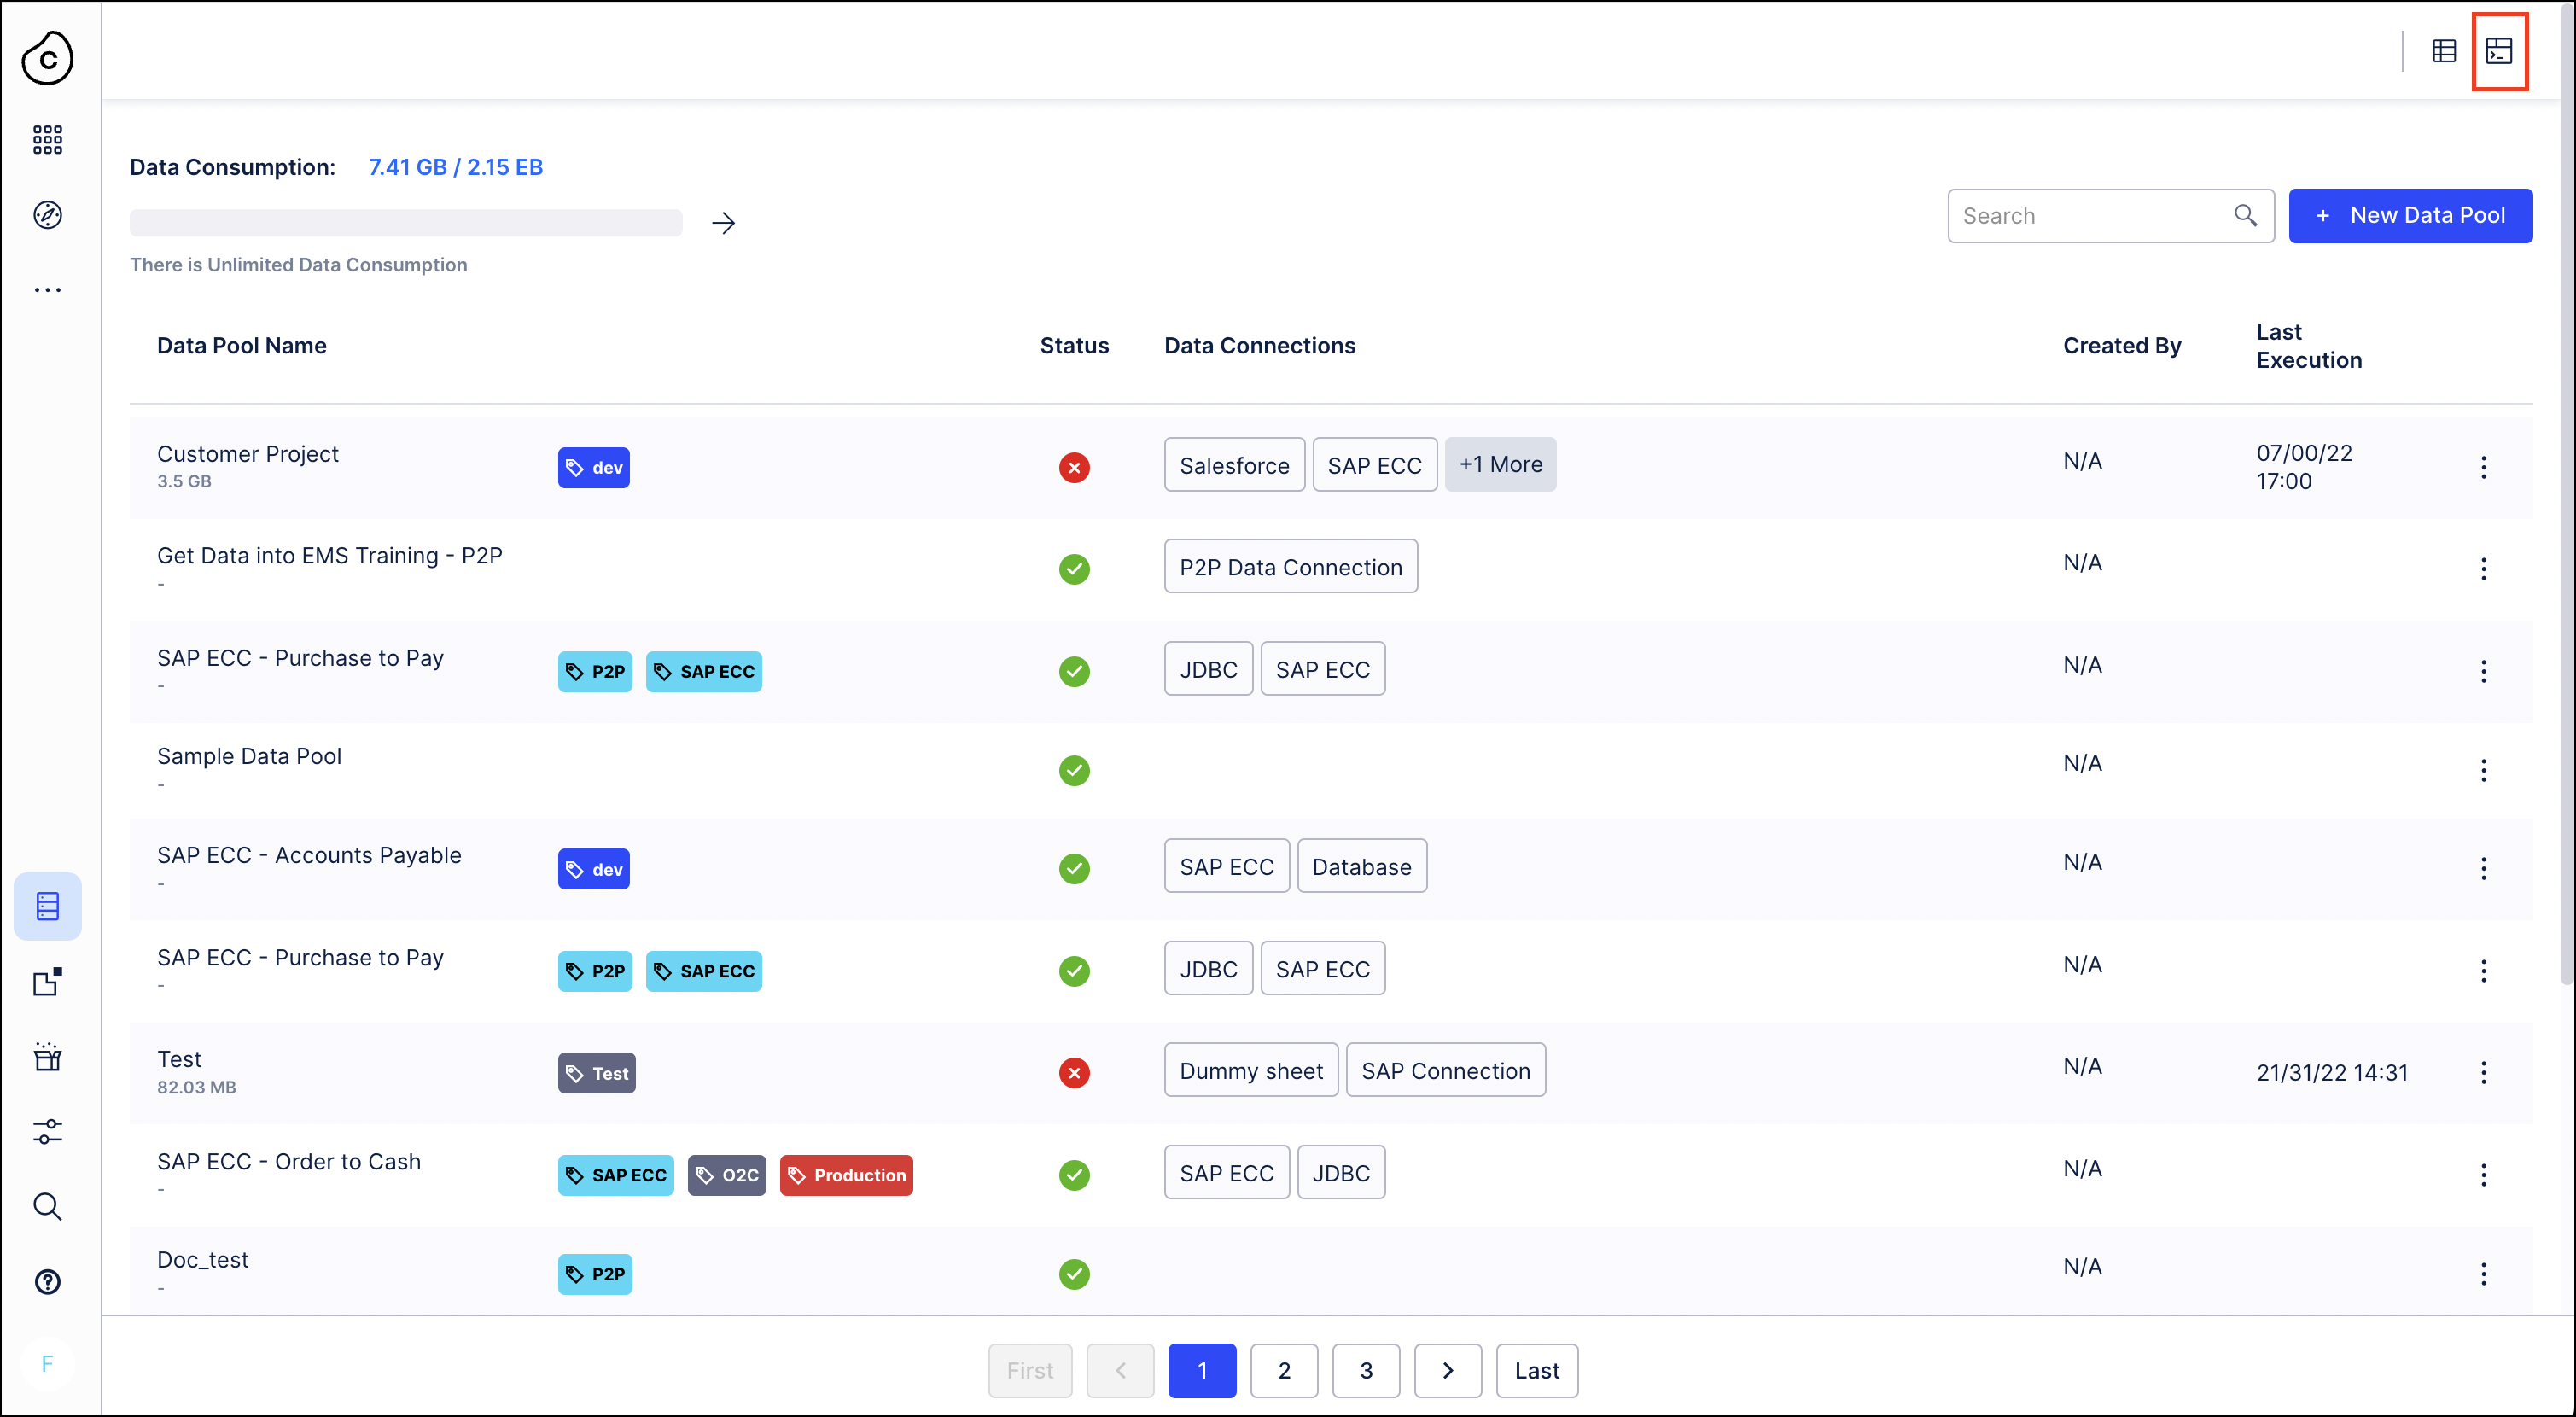
Click on the Monitoring icon in the upper right corner of the screen.
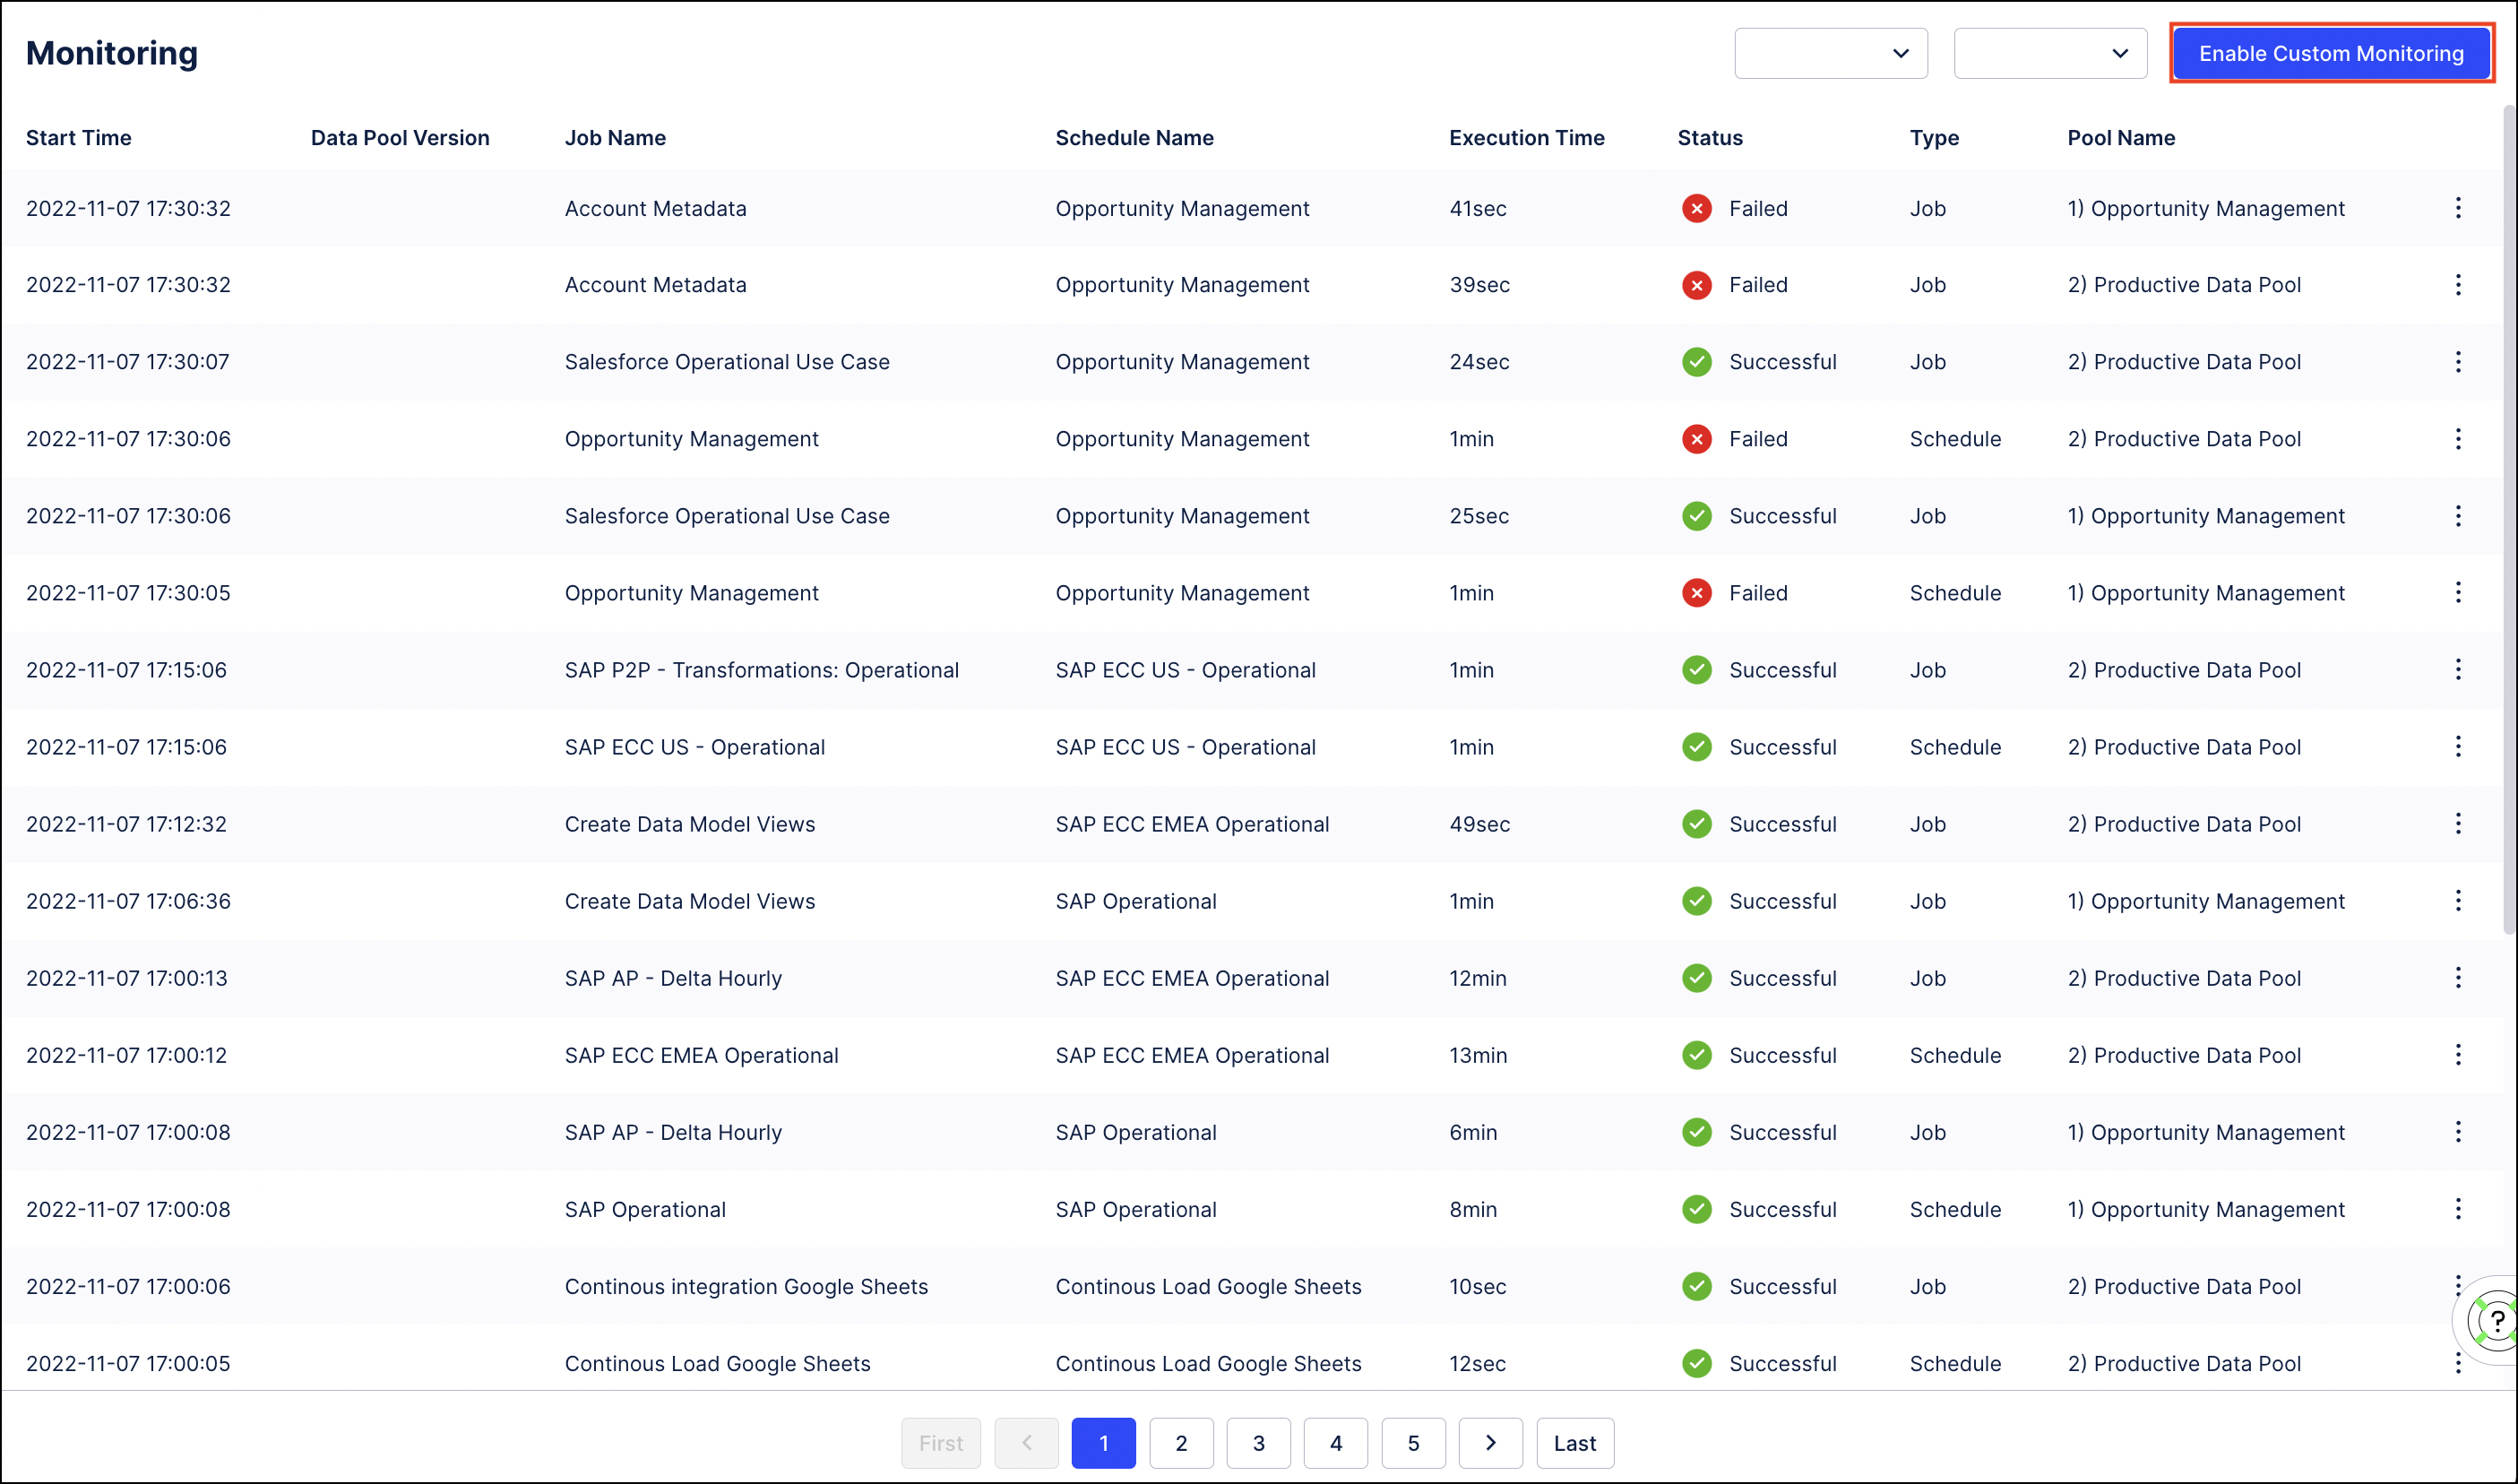
Click the Enable Custom Monitoring button in the upper right corner of the screen.
A new Data Pool named “Monitoring Pool” is created and automatically fed the Data Pipeline logs.
Tip
Do not rename the new Data Pool.
Note
If you previously had Custom Monitoring enabled and a Monitoring Data Pool already exists, that existing Data Pool will continue to be used to store logs and a new Data Pool will not be created.
Note
The tables of the Custom Data Pipeline Monitoring are created with the first events captured after enabling this feature. No past events are captured.
The data_consumption_updated_events table is created with the first APC calculation for the team, which can take several days. Until then, the "Data Consumption Monitoring" data job will fail.
The replication_execution_finished_events table is created with your first Replication Cockpit Execution. If the Replication Cockpit is not set up, the “Replication Cockpit Monitoring" data job will fail.
Disable Custom Monitoring
Go to Data Integration.
Click on the Monitoring icon in the upper right corner of the screen.
Click the Disable Custom Monitoring button in the upper right corner of the screen.
The Monitoring events will no longer be pushed to the Monitoring Data Pool.
Note
The Monitoring Data Pool is not deleted automatically. To delete the Monitoring Data Pool, use the three-dot menu in the Data Pool overview. If you delete the Monitoring Data Pool without disabling the Custom Monitoring first, it will be disabled automatically.
Note
If you re-enable Custom Monitoring and the Monitoring Data Pool still exists, this existing Data Pool will continue to be used to store logs and a new Data Pool will not be created.
Install the Views
Go to the Marketplace.
Search for “Monitoring” using the search bar in the upper right corner.
Select the Monitoring package and install it in a Studio space of your choice.
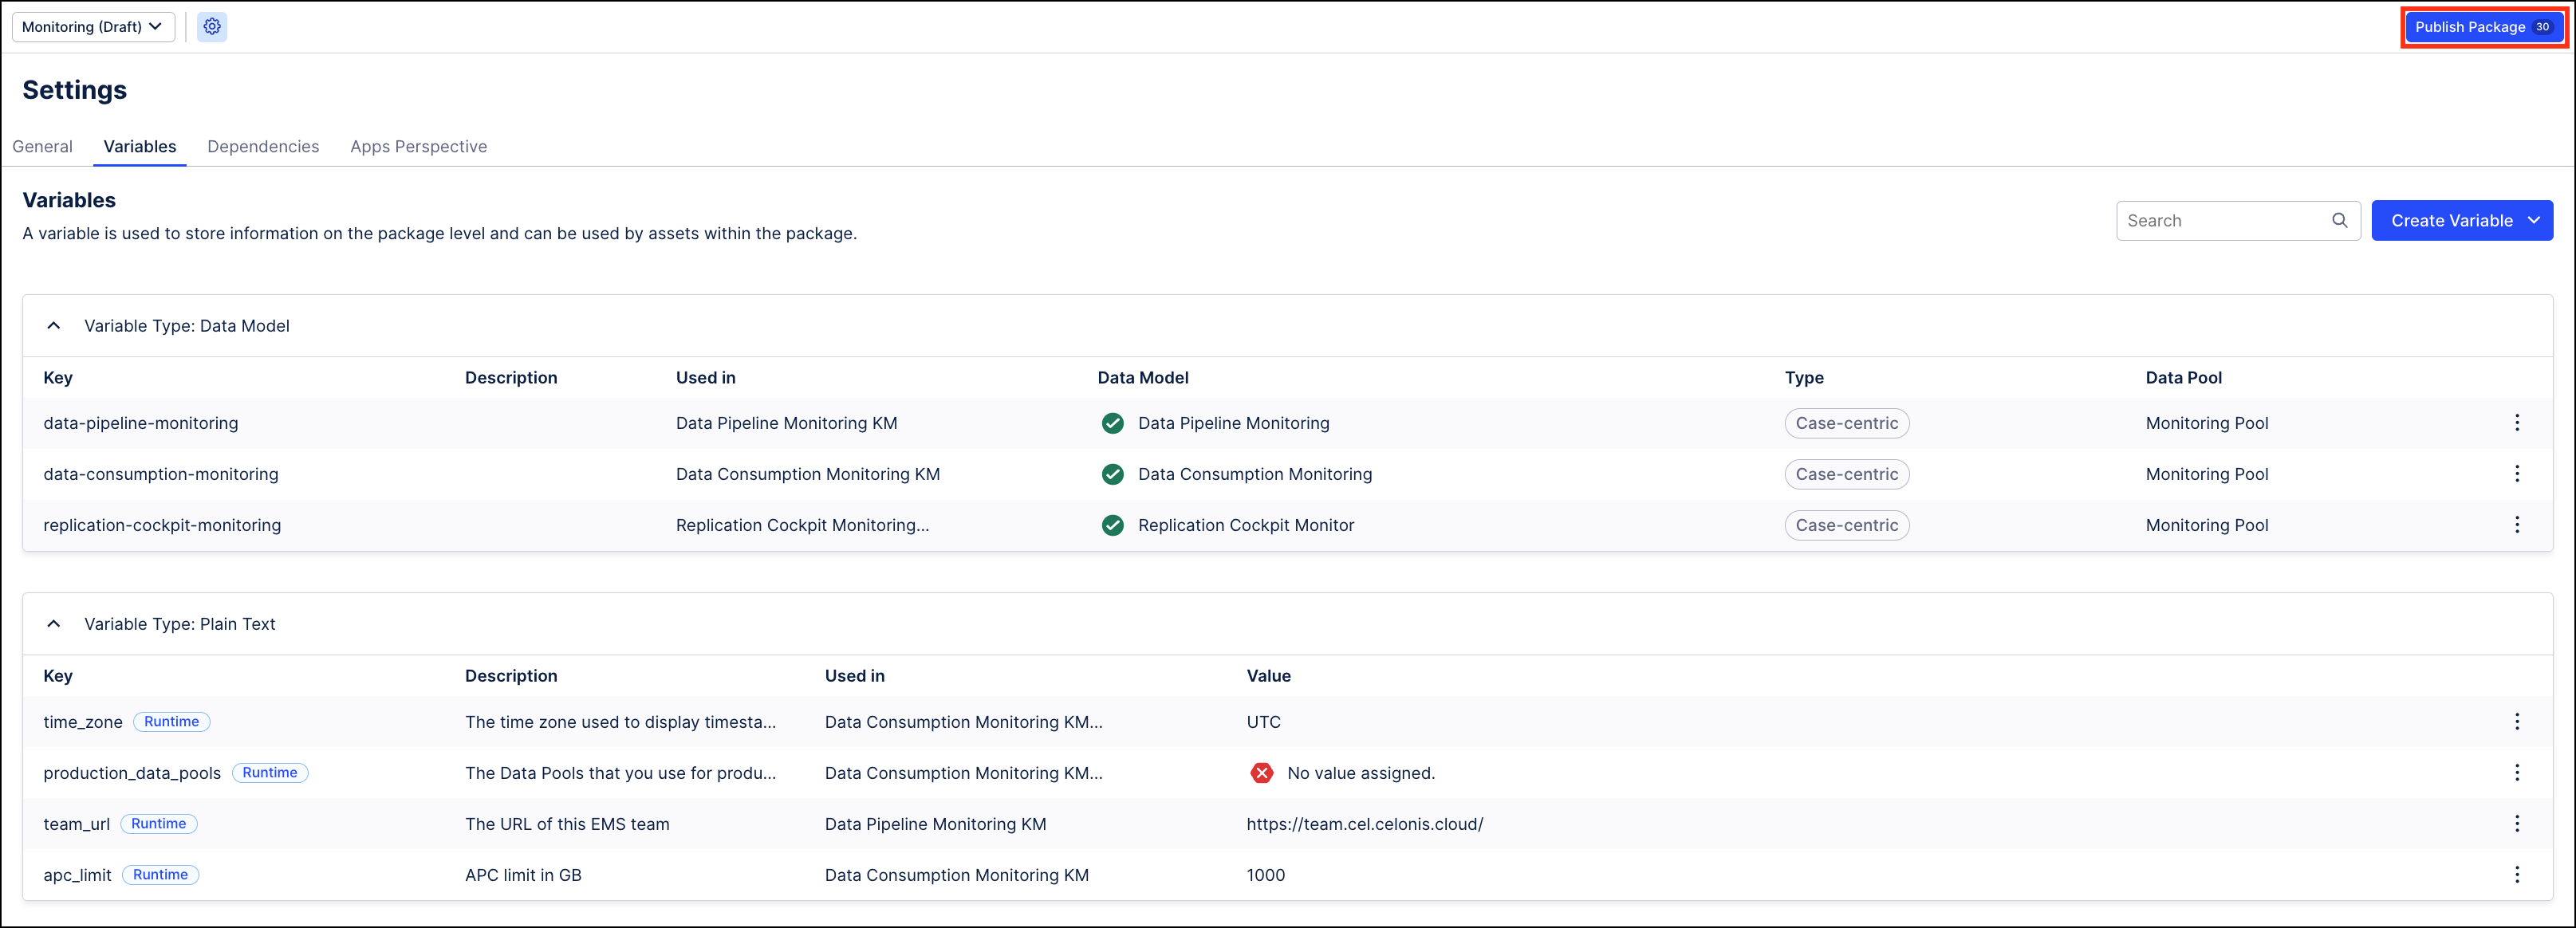
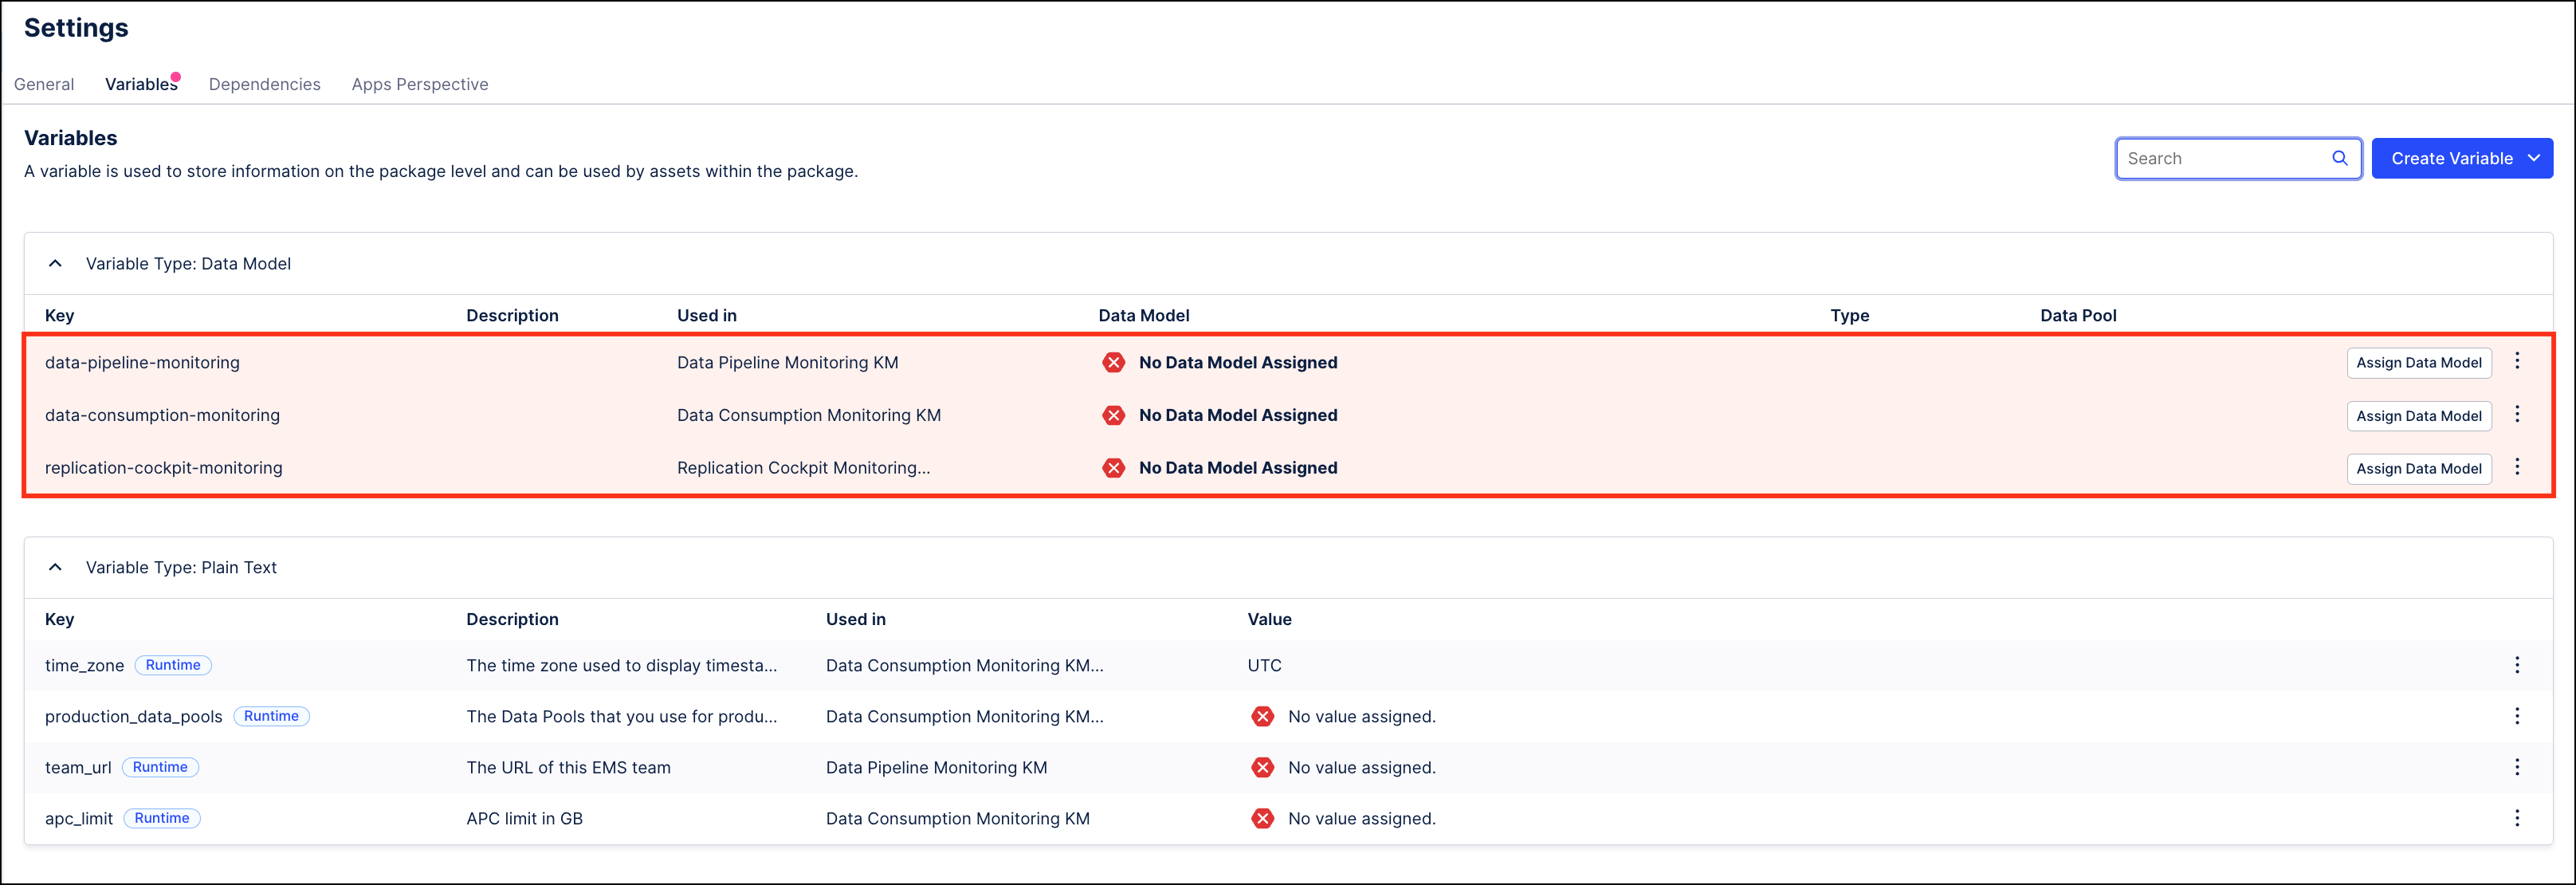
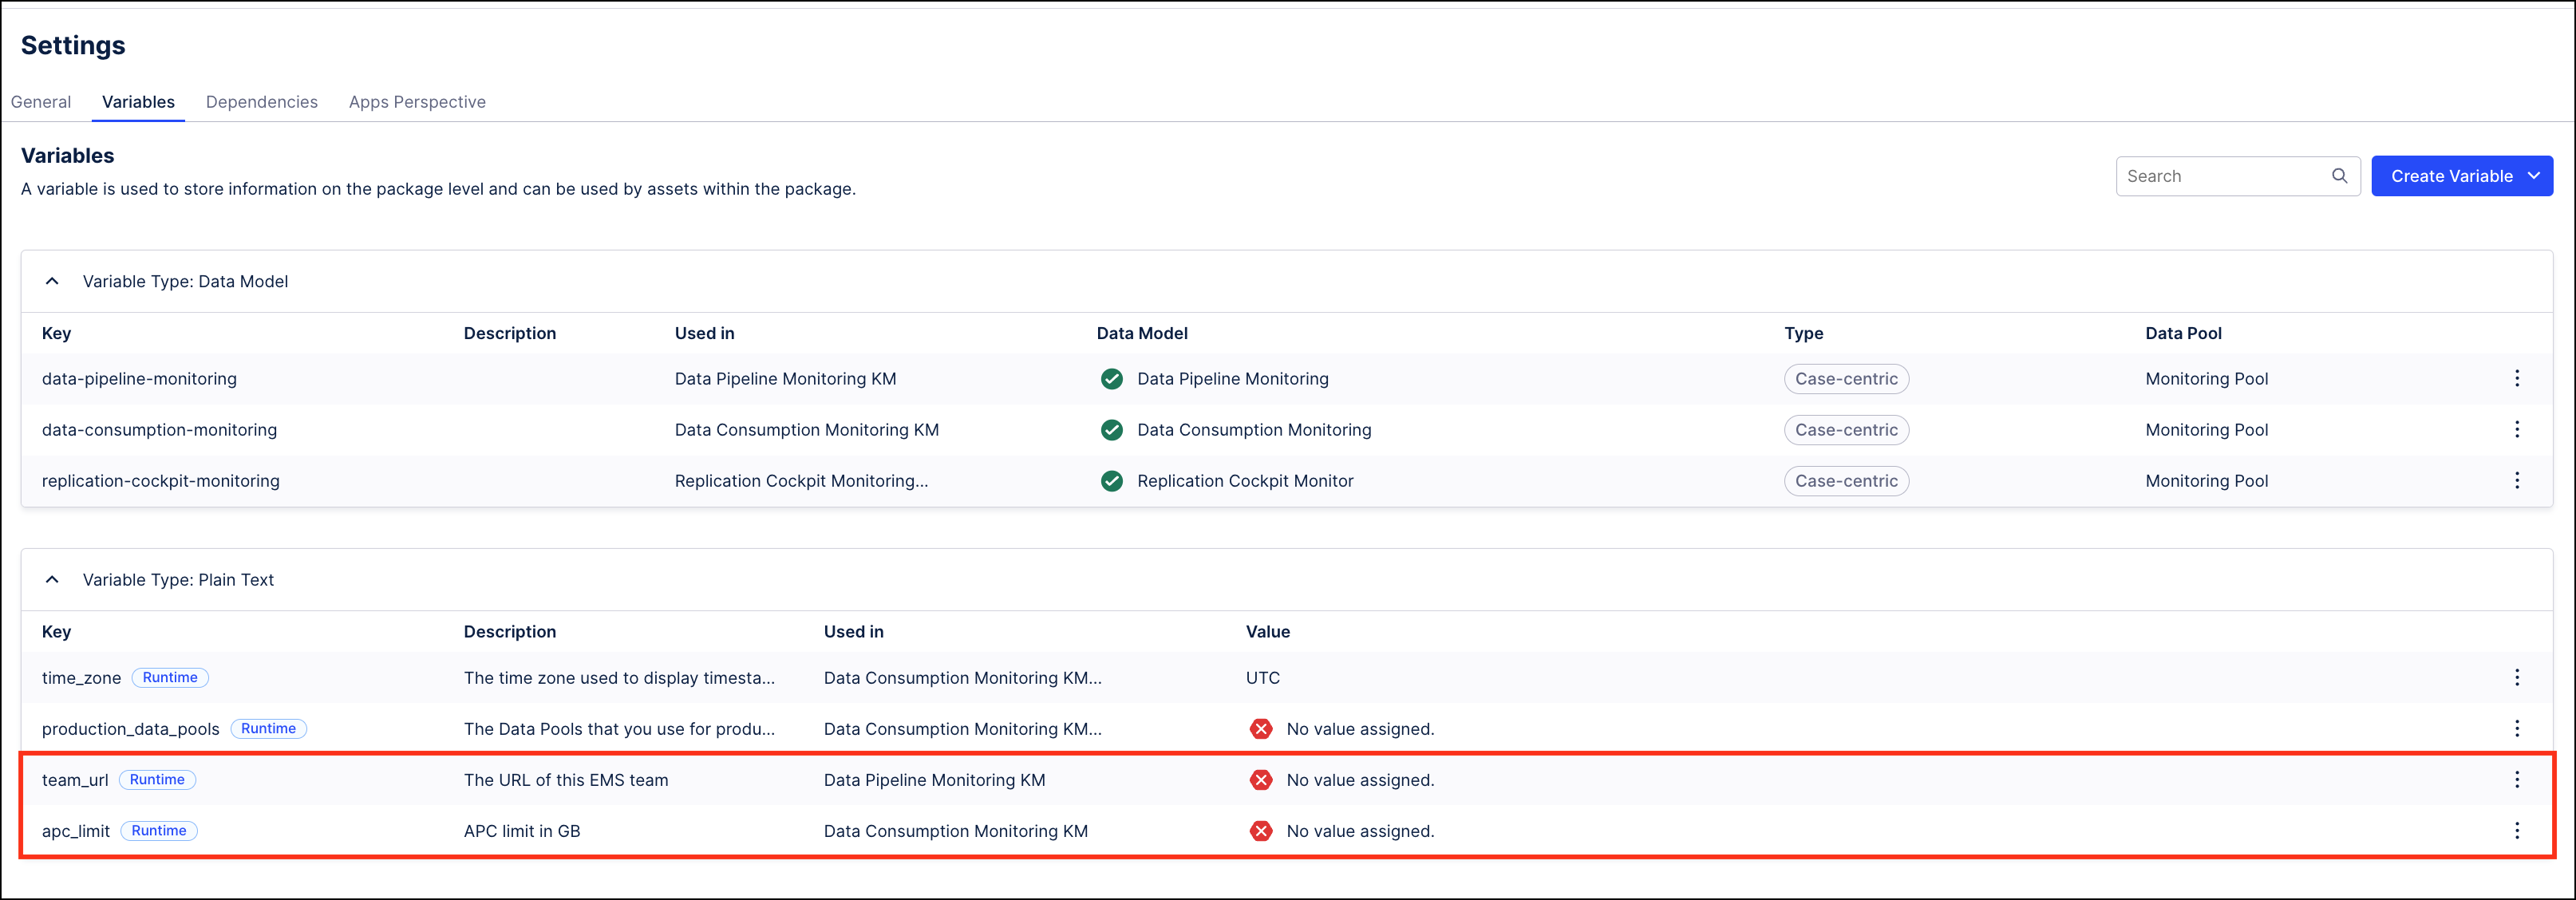
Assign the Monitoring Data Models to the Data Model variables in the package settings of the newly installed package.
Update the apc_limit and team_url variables which store your team’s APC limit (if applicable) and your team’s URL. These variables are used in the Monitoring Views to correctly display your teams’ APC usage as percentage and to provide a direct link from the Monitoring Views to the execution logs in Data Integration.
Click the Publish Package button in the upper right if you want to make the newly installed assets available in Apps.